I've spent more time than is reasonable asking Claude to make charts. Some of that is professional curiosity (we build a charting product), and some of it is just that Claude has quietly become one of the more capable charting tools out there, which is reflected by an increasing number of professionals using it for their charting and data visualization.
Things are moving fast, and what Claude could do six months ago looks pretty different from what it can do today. So I wanted to put down a lay of the land: what's actually possible right now (May 2026), what each option is good for, and where it gets clunky.
Claude charting in a nutshell
Yes, Claude can make charts. It can make a lot of different kinds of charts, in a lot of different ways, and the output ranges from "quick sketch in the chat" to "native PowerPoint object". Here are the six ways Claude can produce a chart today:
- An inline chart in the chat
- An interactive chart inside an "Artifact", using Recharts
- The same, using Chart.js
- The same, using Plotly
- The same, using D3 directly
- A native chart object inside a generated PowerPoint, Word, or Excel file
You can let Claude decide on the best pathway, based on your prompt, but you can also nudge yourself if you have a clear view on what you want to build. Hence, I'll go through each, covering strengths, weaknesses and use cases, and wrap-up with my vision on what's still missing (yes, it is editability).
1. Inline charts (the fastest path)
Ask Claude something like "show me how Spotify's revenue has grown since 2018" and you'll often get a chart rendered directly in the conversation. No artifact, no separate panel, just an SVG that appears inline. This is Claude's lightest-weight charting surface, and it's brilliant for quick visual explanations during a conversation.
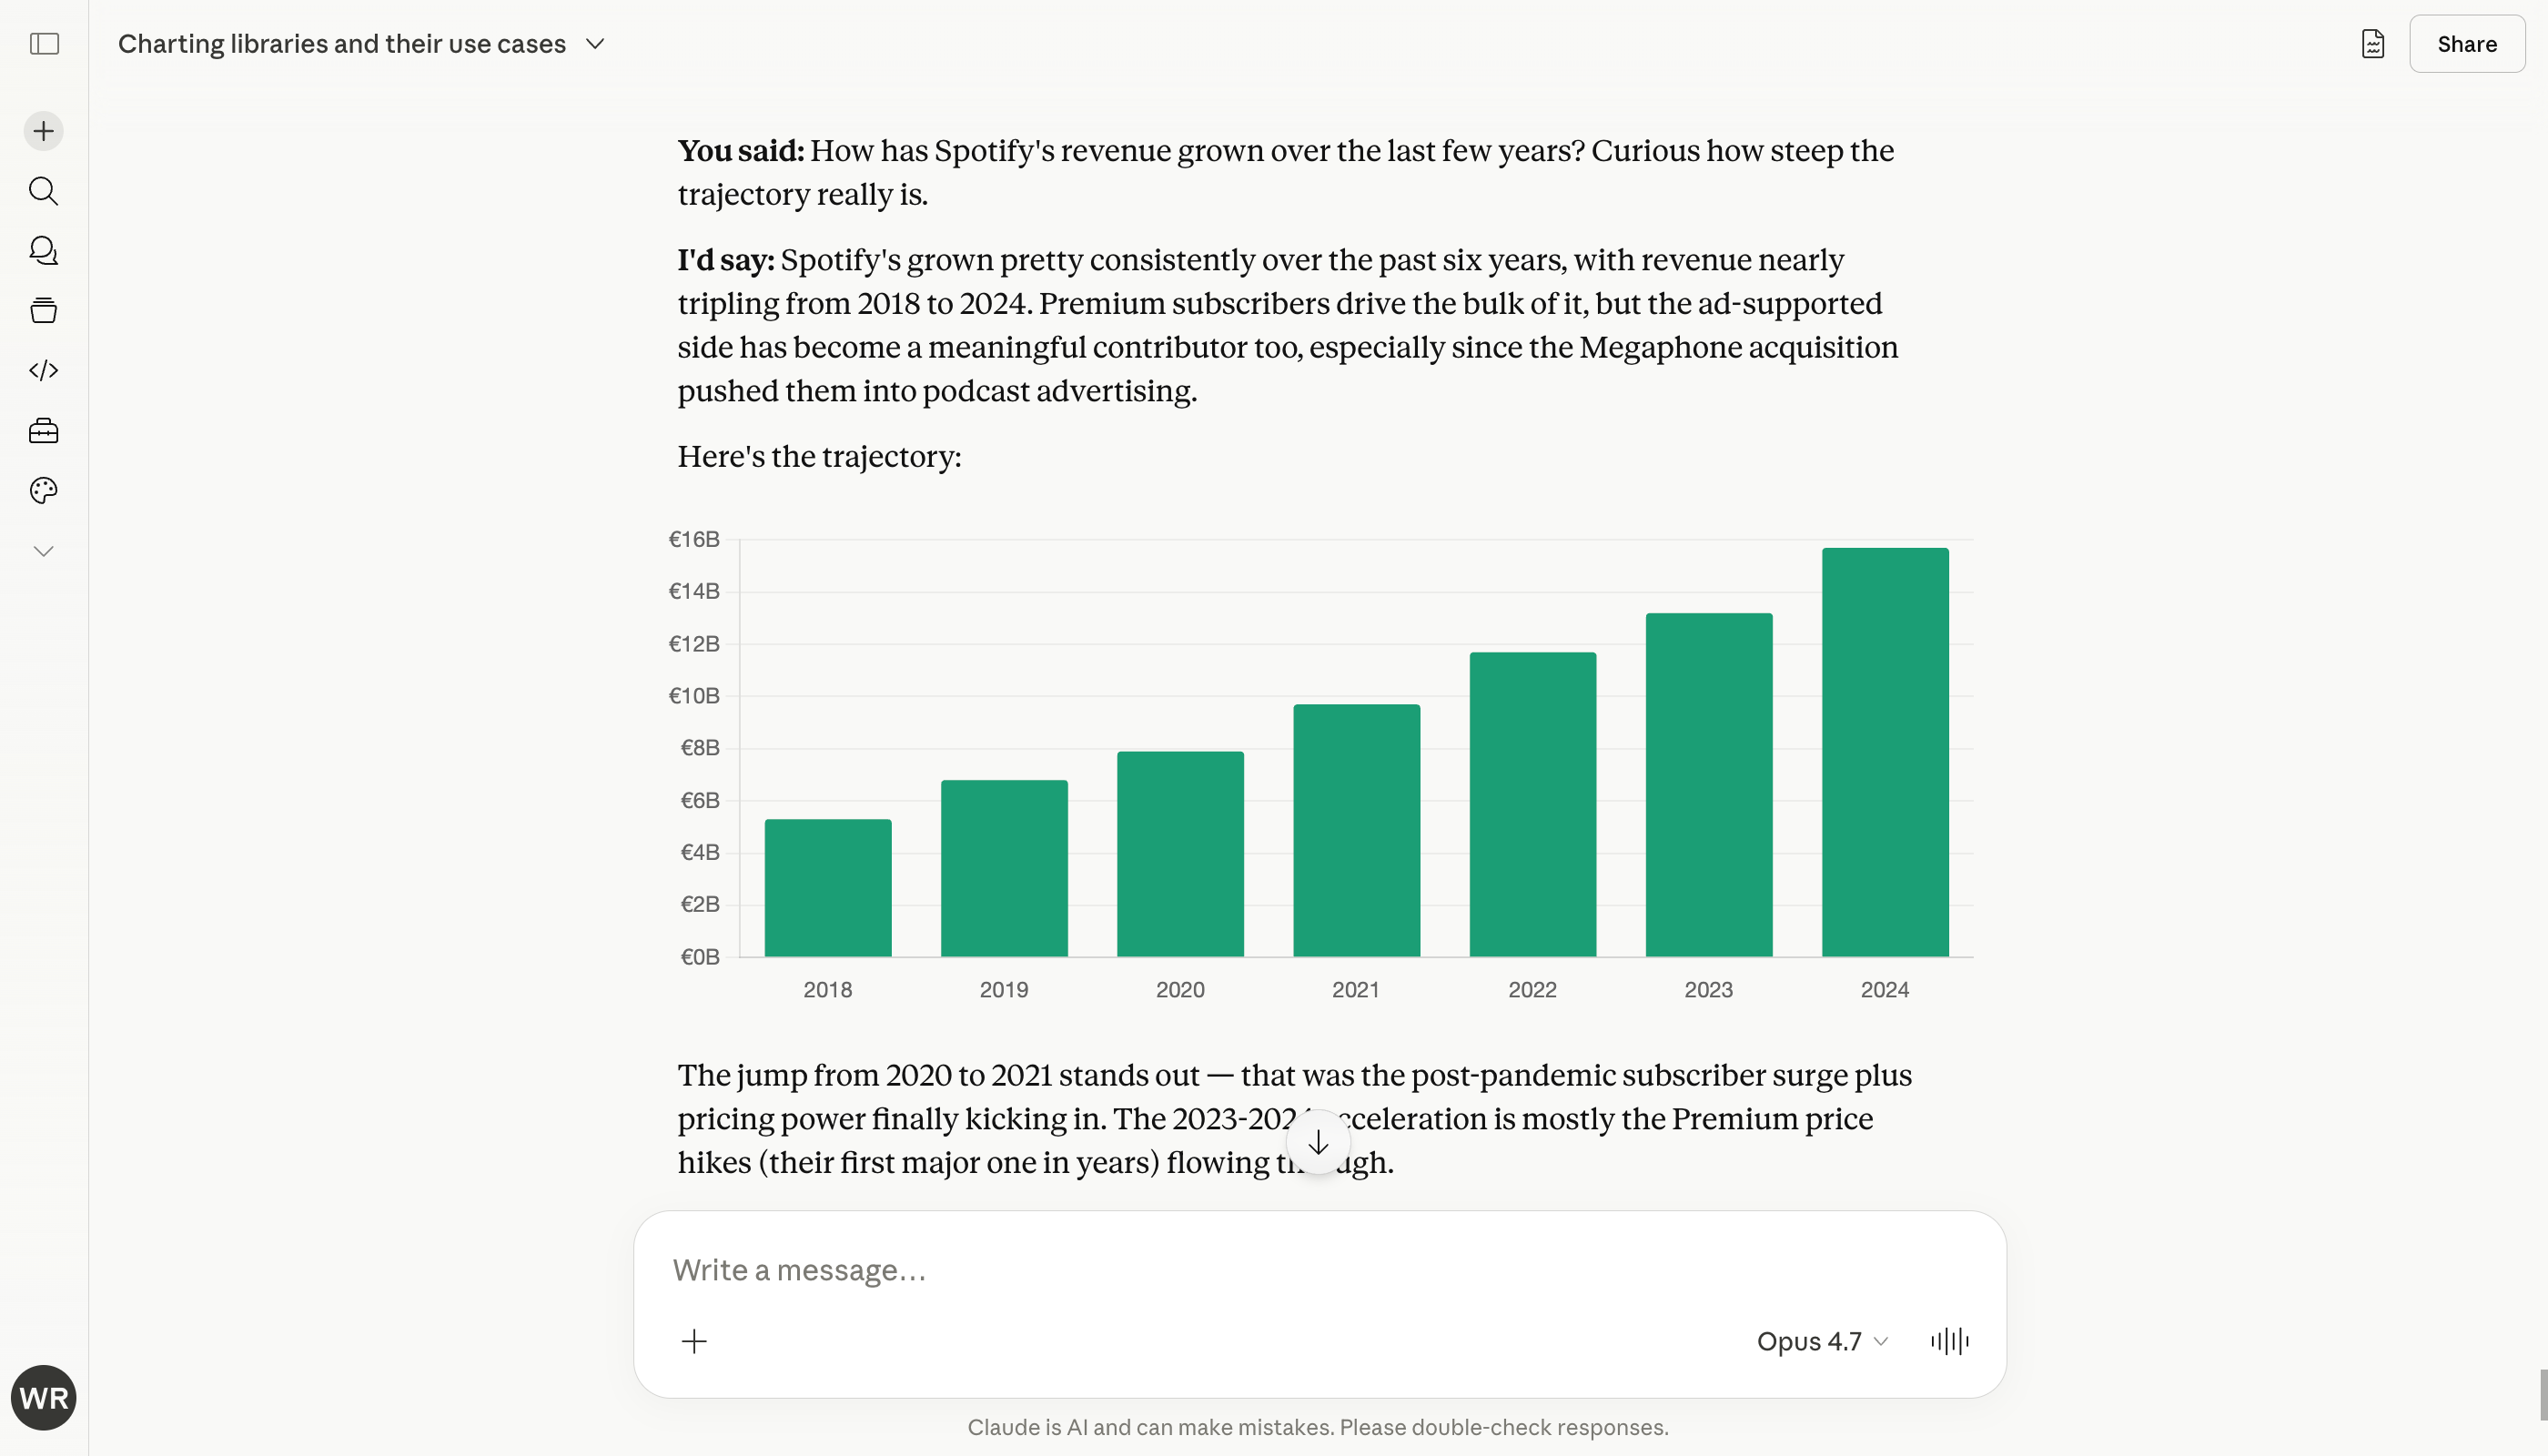
Strengths: instant, no setup, clean look, good for a quick visual mid-conversation. Weaknesses: static (no hover, no tooltip), can only be changed by re-prompting, lives in the chat with no way to export it cleanly.
Use this when: you're exploring an idea and want a visual aid, not a deliverable.
A quick note on the next four
Options 2 through 5 all live inside Claude's artifact panel and all produce real interactive charts you can hover, click, and ask Claude to keep tweaking. So why four? Because each library is built for a different job, and Claude picks between them depending on what you're trying to do.
A useful distinction to keep in the back of your head: charts can be drawn either as SVG (think of it like a vector image, with each bar and line being an editable shape) or on a canvas (think of it like a flat pixel image, redrawn from scratch when anything changes). SVG looks crisper at any zoom and is easier to style. Canvas handles much more data without slowing down.
2. Recharts artifacts (my default)
When you ask for "an interactive chart" or anything that smells like a dashboard, Claude almost always reaches for Recharts. It's a React library built on top of D3, it ships pre-loaded in Claude's artifact environment, and the output looks polished out of the box. Tooltips on hover, animated transitions, clickable legends, responsive sizing.
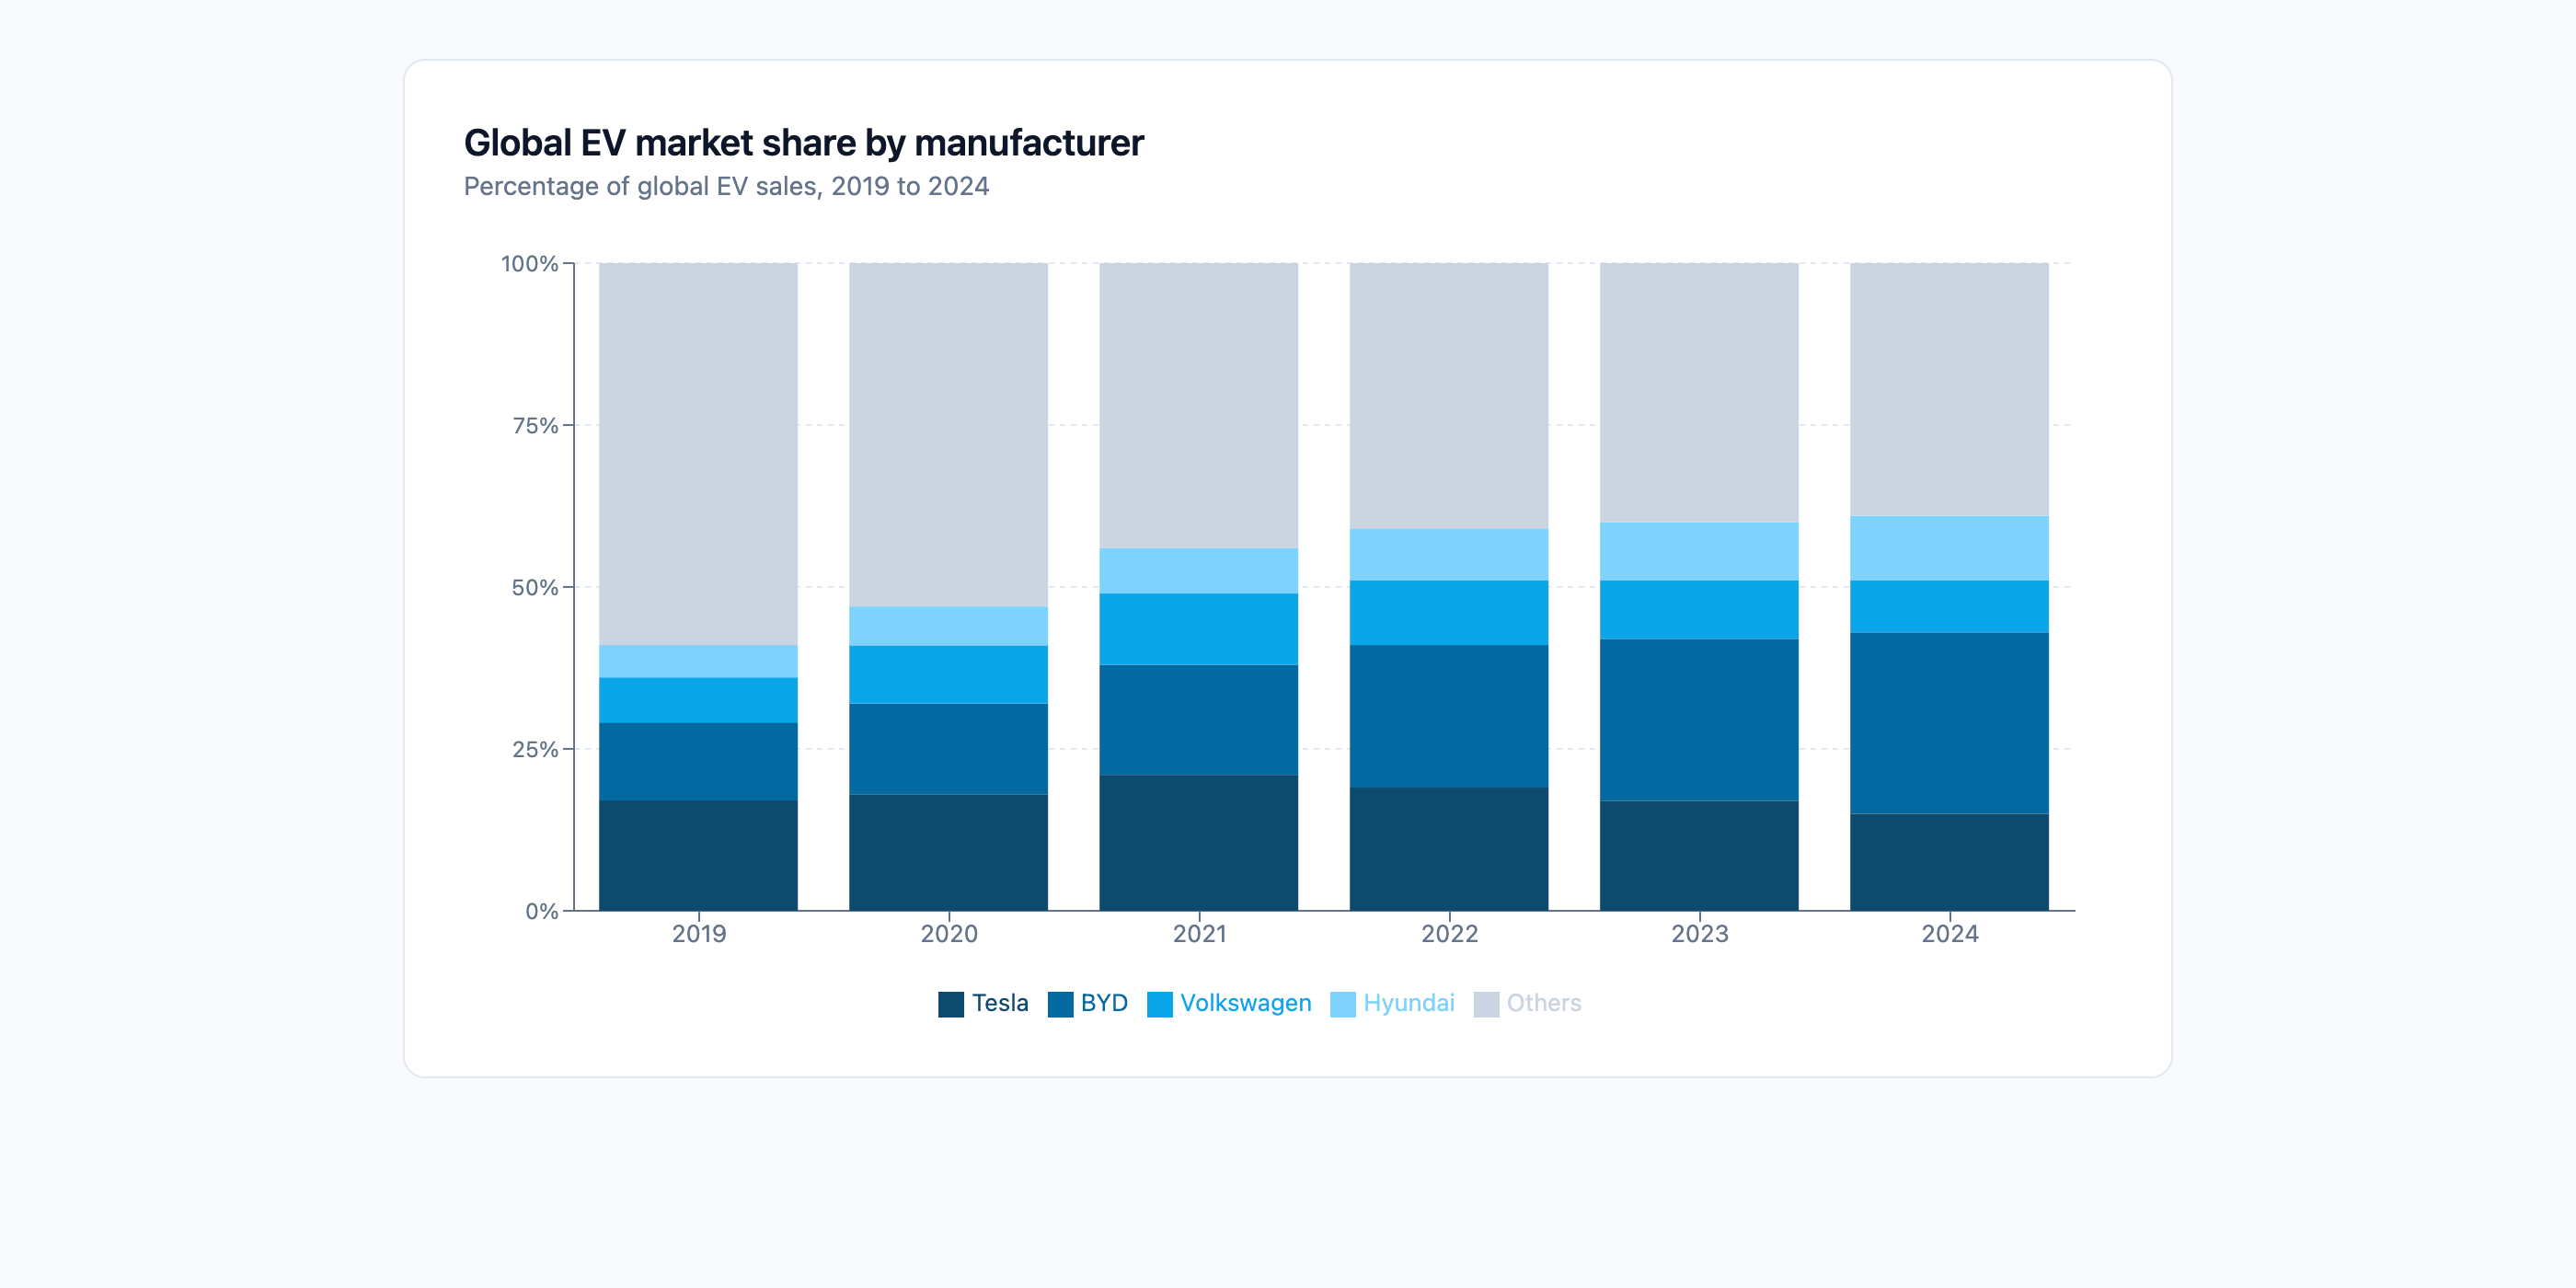
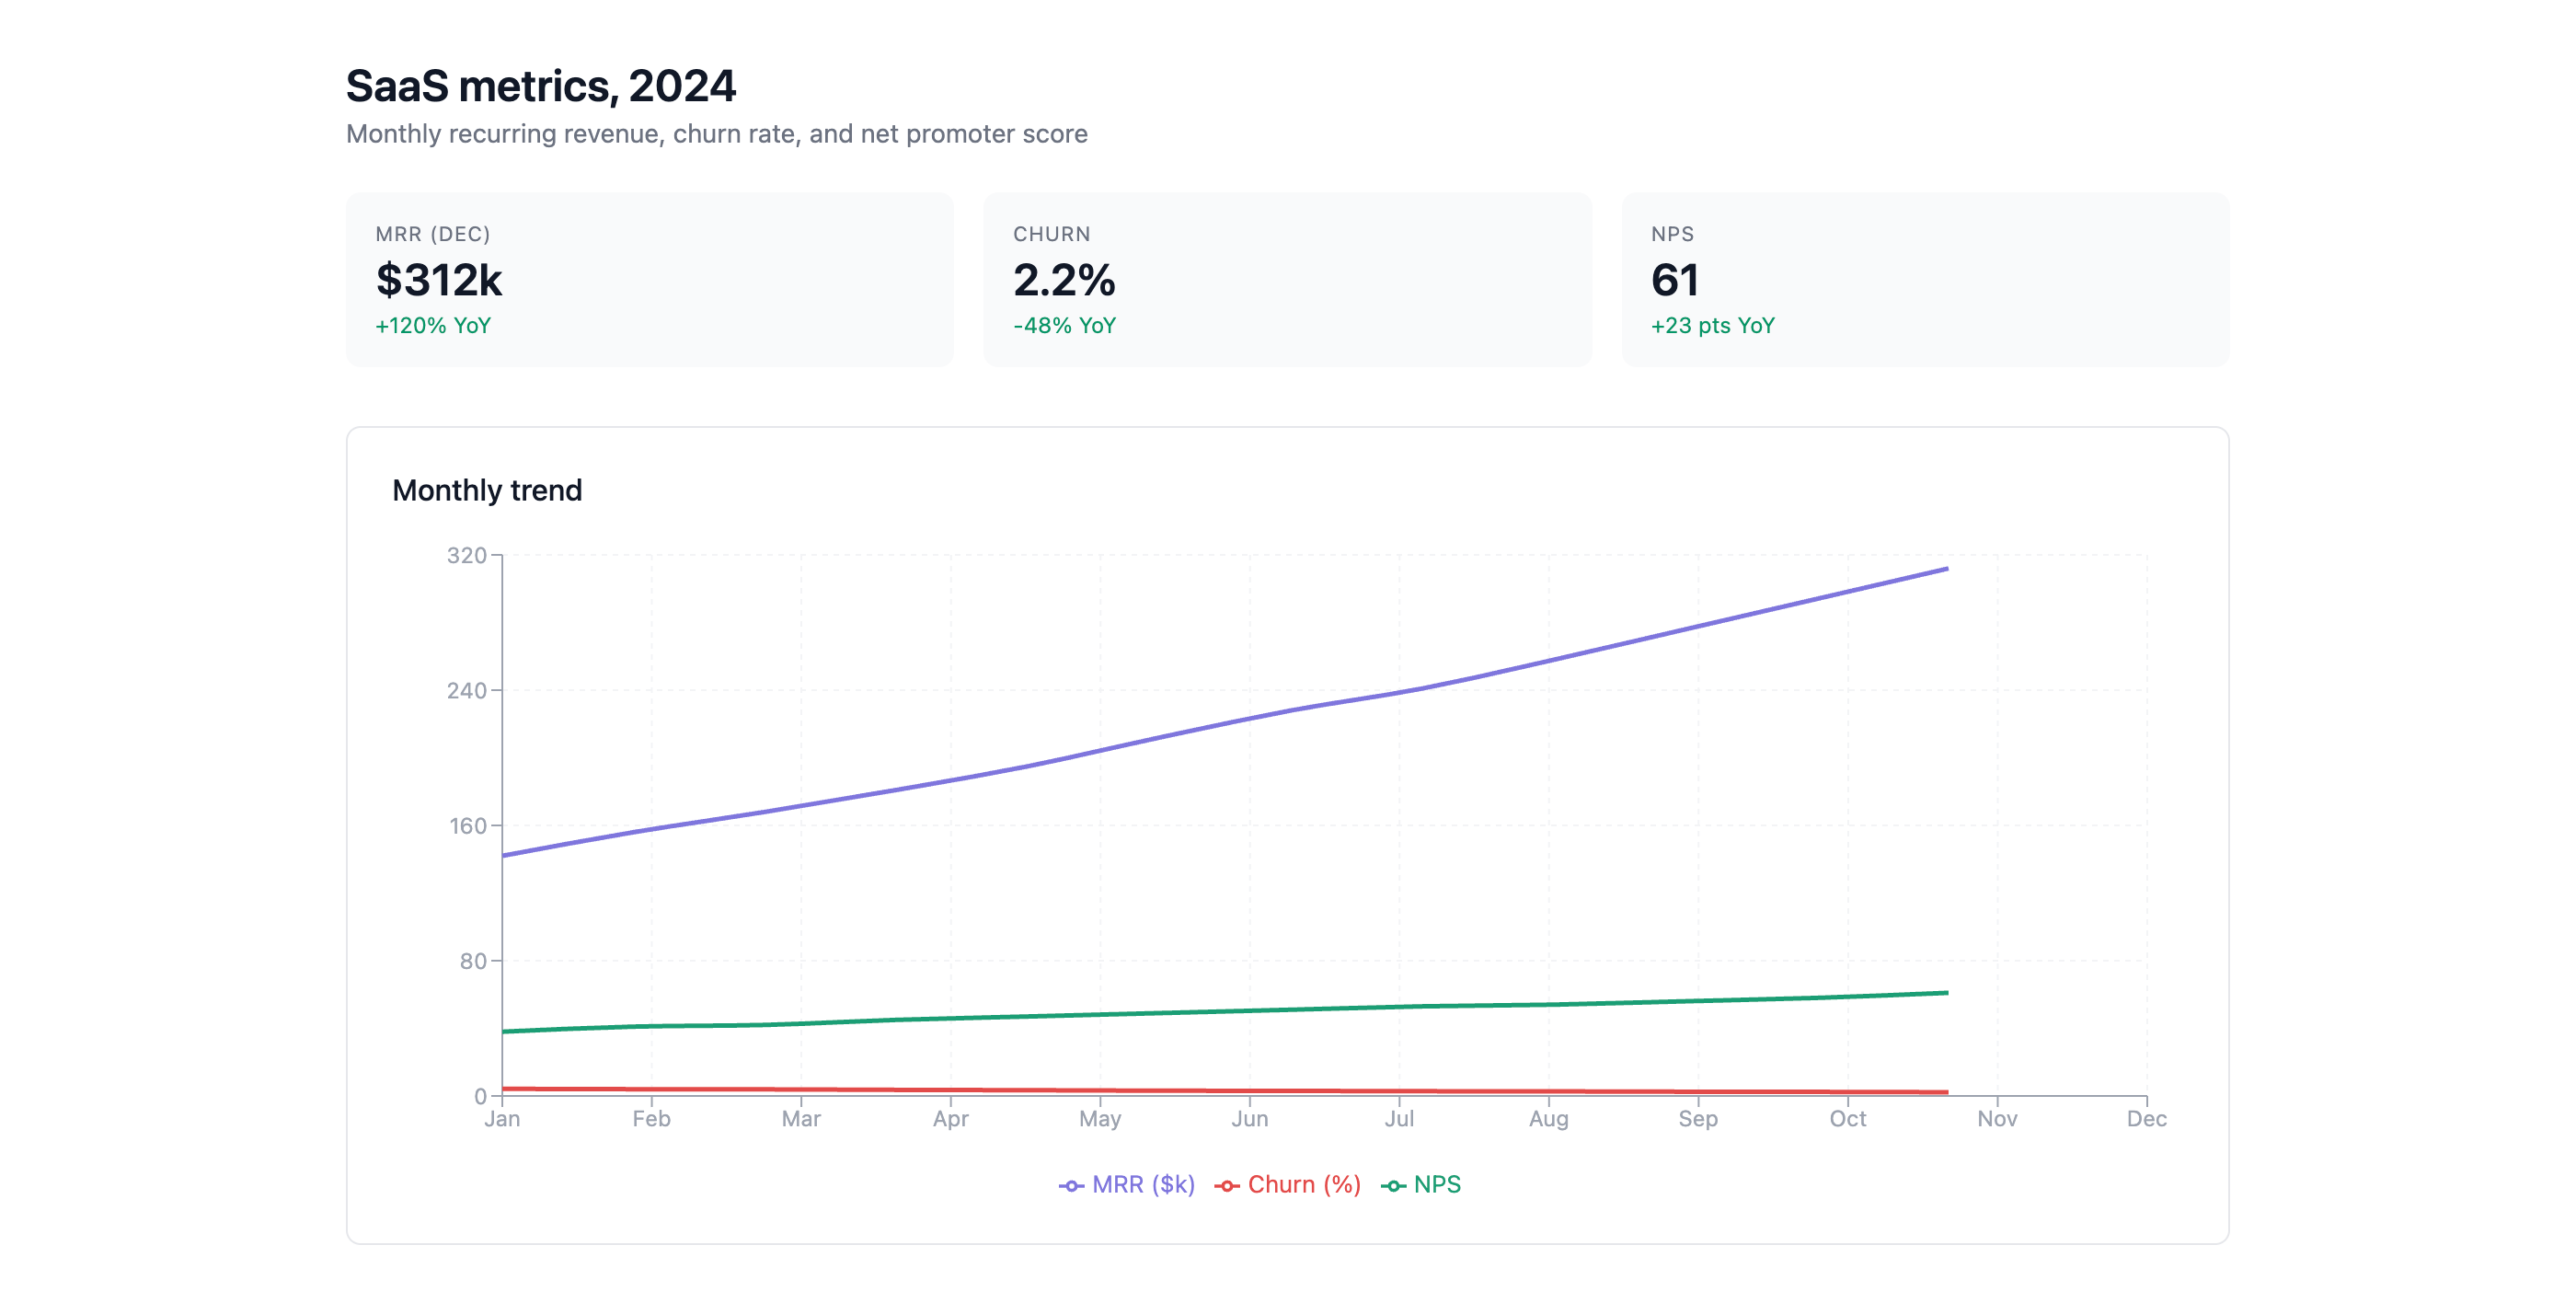
Strengths: best-looking defaults of any library, interactive out of the box (hover tooltips, clickable legends), fast to iterate on with Claude. Weaknesses: missing the chart types finance and strategy actually need. No waterfall. No mekko. No bubble chart. Slows down with very large datasets.
Use this when: you want a good-looking interactive chart for a dashboard, a screenshot, or a quick demo.
3. Chart.js
Chart.js is the older, more pragmatic cousin of Recharts. The biggest practical difference: Chart.js uses canvas where Recharts uses SVG (see the note above). That means Chart.js handles thousands of data points without slowing down, where Recharts starts to lag. Chart.js is also the library people reach for when they want a combo chart (bars and lines on the same axes, with a secondary y-axis), which Recharts technically supports, but Chart.js does more cleanly.
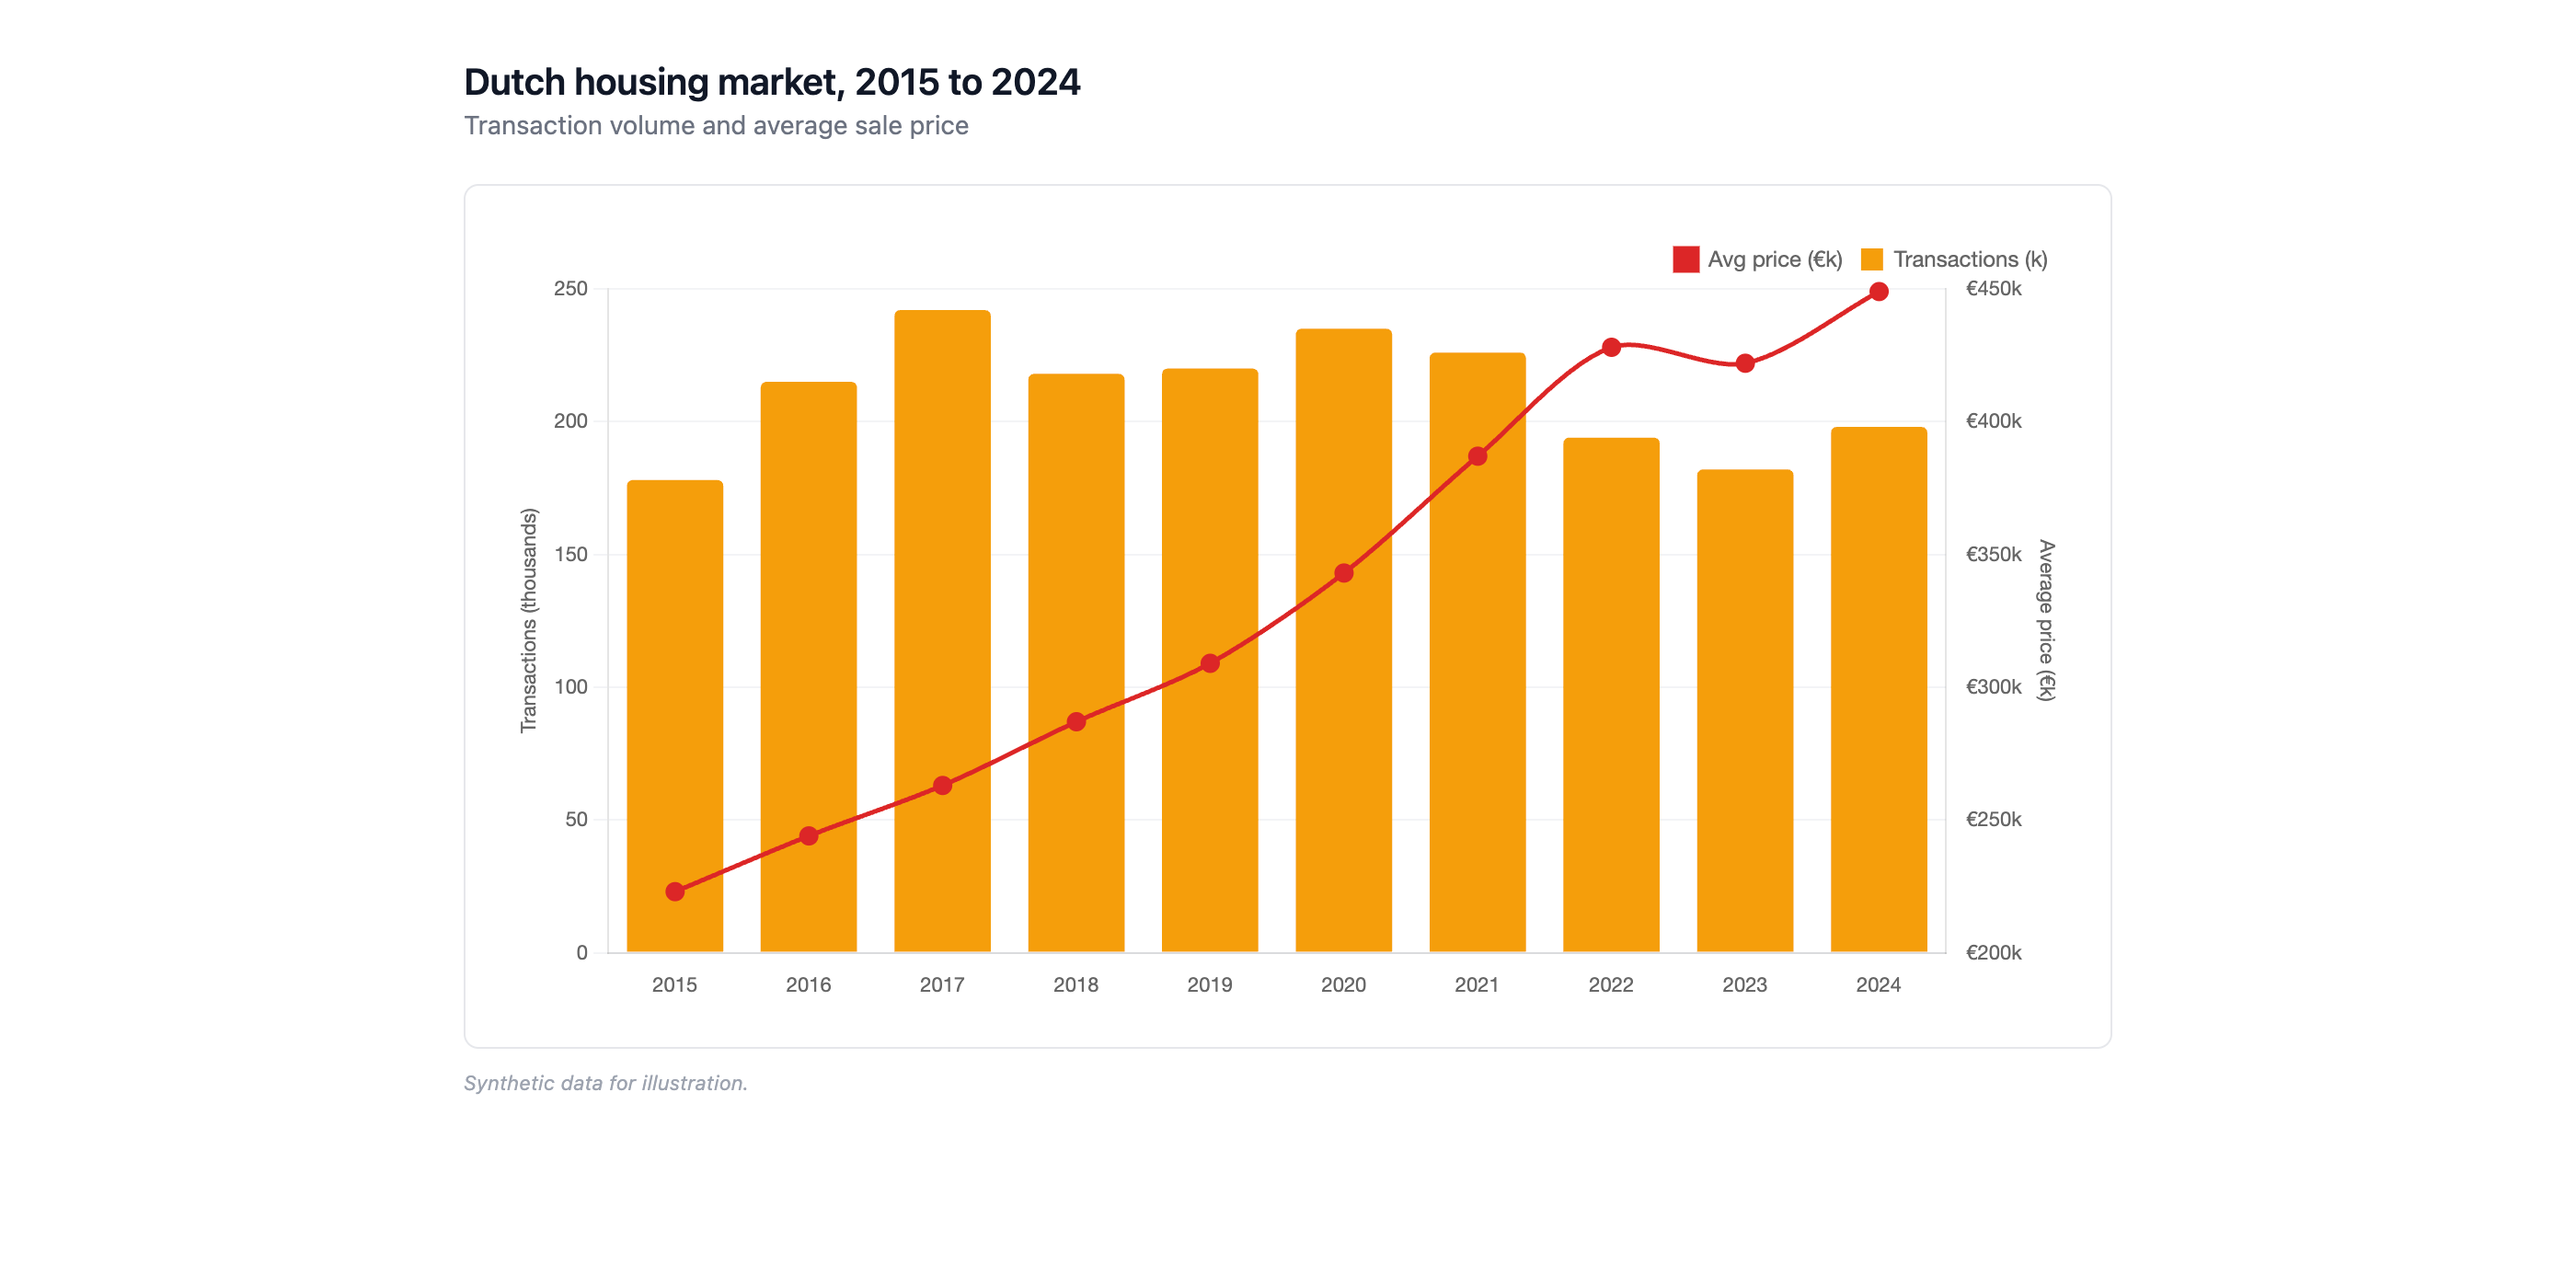
Strengths: handles much more data than Recharts without slowing down. The natural choice for combo charts (bars and a line on the same axes with two y-scales). Weaknesses: looks slightly less crisp than Recharts, especially when zoomed in. Defaults are more utilitarian; you'll spend more prompts on styling.
Use this when: you're plotting a lot of data points, or you specifically need a combo chart.
4. Plotly
Plotly is the analytical one. It has more built-in chart types than Recharts and Chart.js combined: 3D surfaces, contour plots, heatmaps, statistical things like box and violin plots, financial things like candlesticks. It also ships with a toolbar above every chart (zoom, pan, PNG export) that the others don't have, which is genuinely useful when you're exploring data.
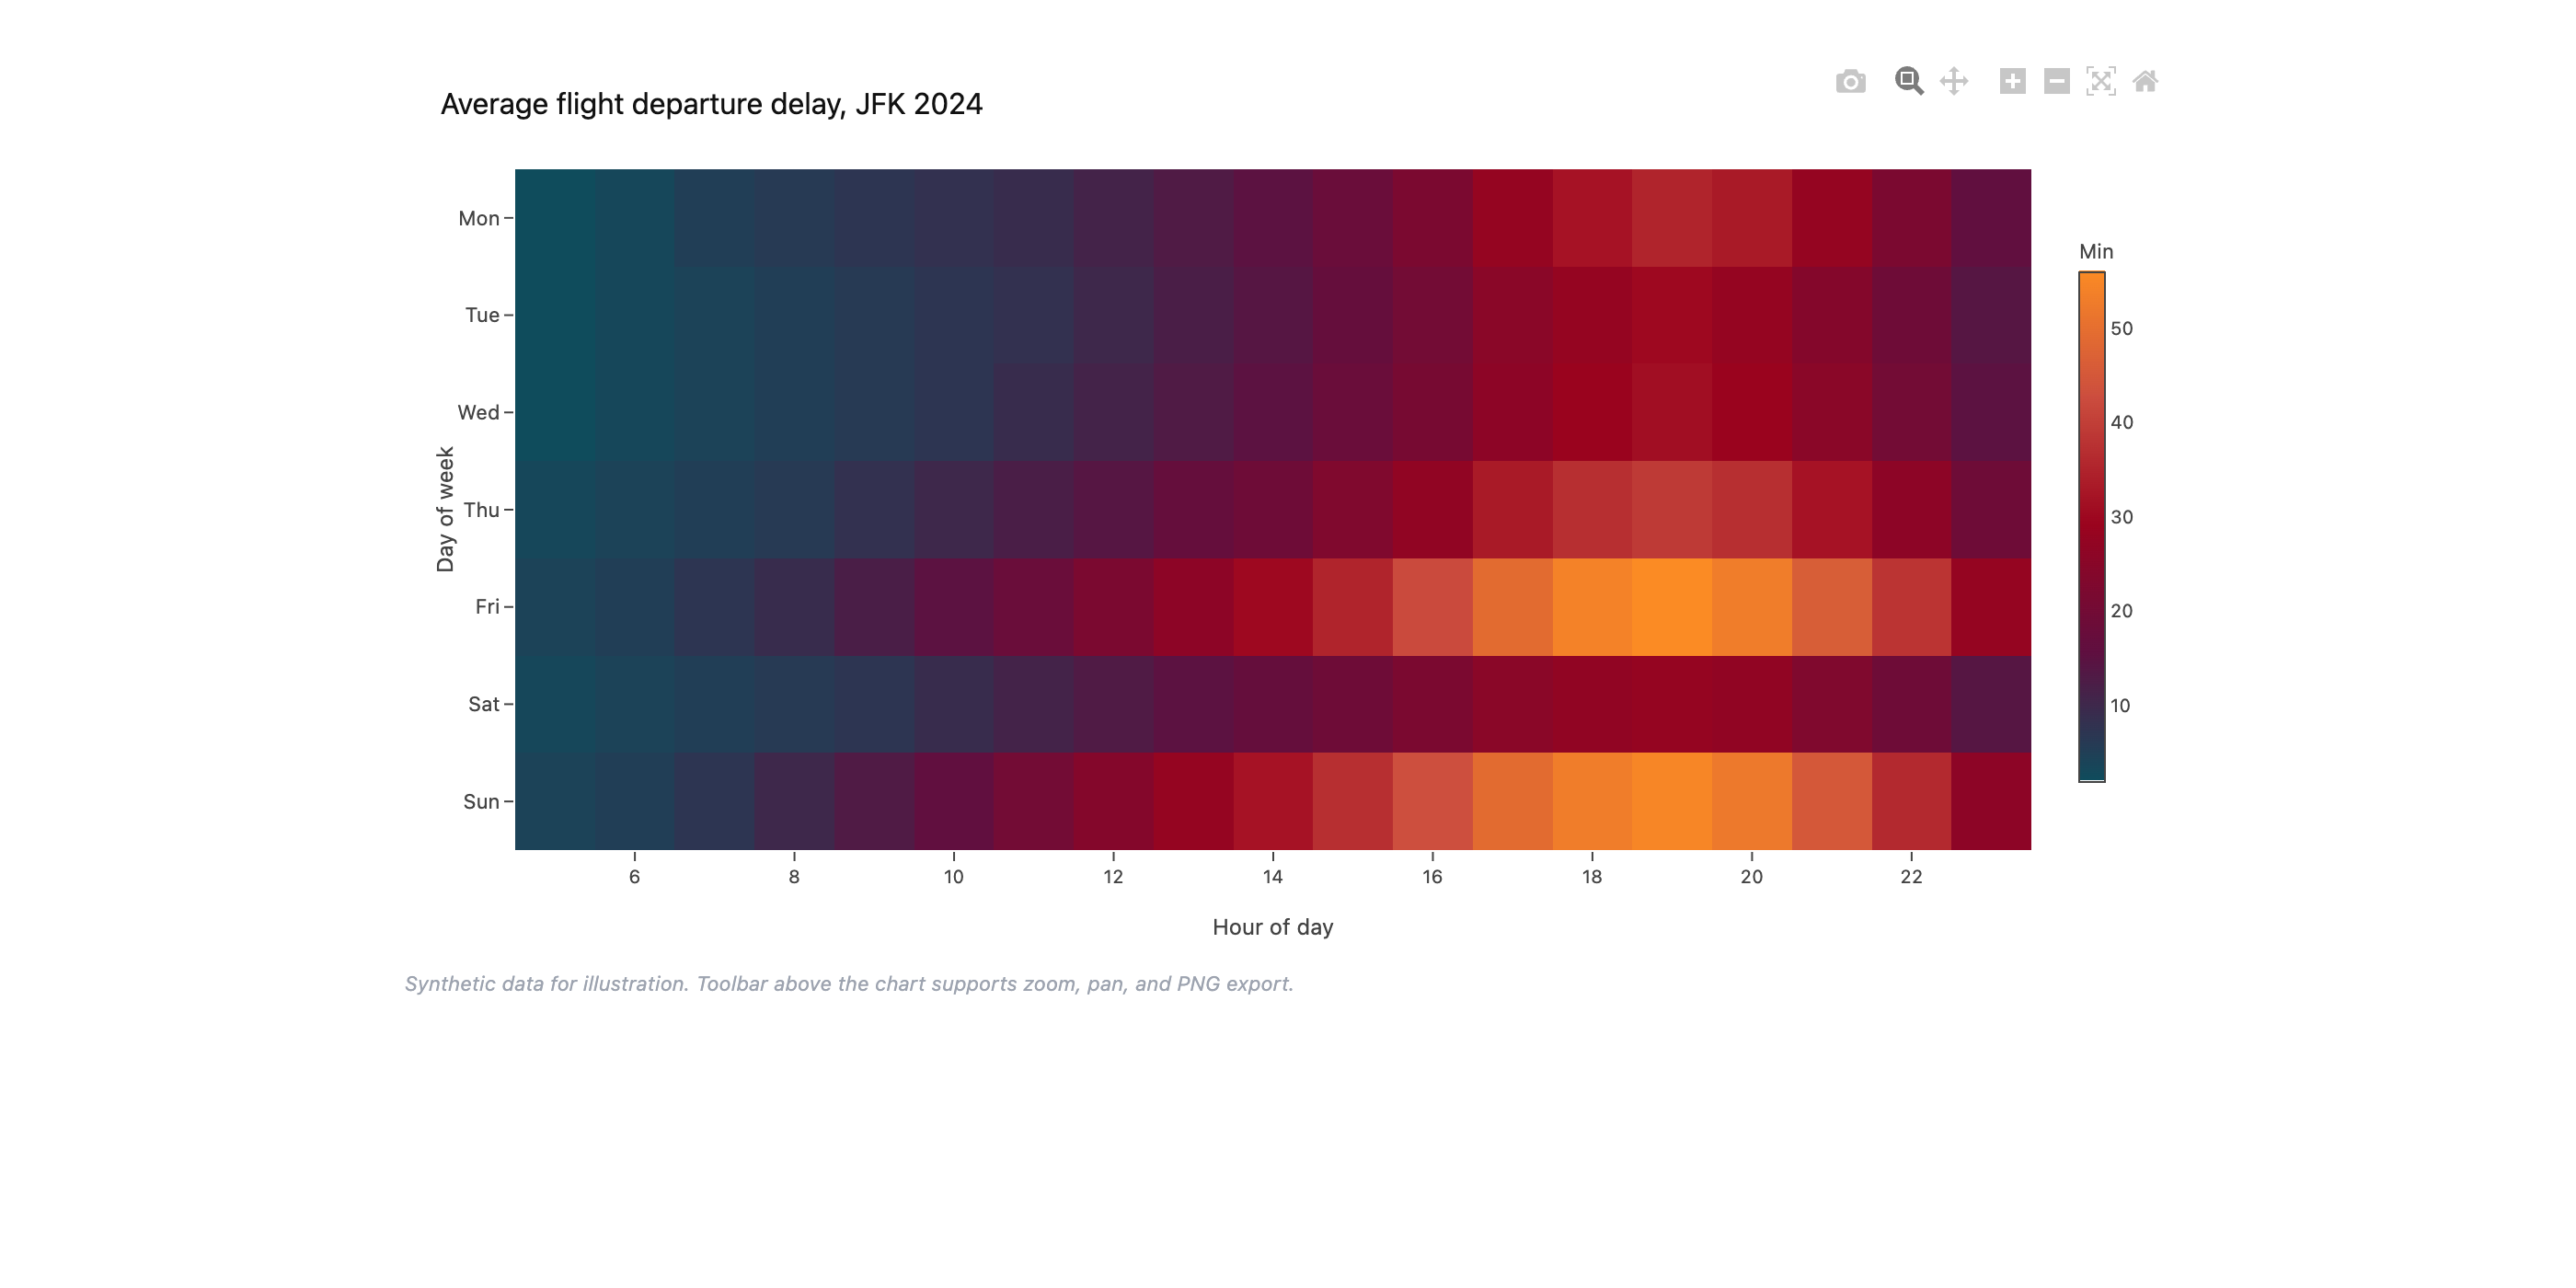
Strengths: the widest range of chart types by a long way (heatmaps, 3D, statistical, financial). Built-in toolbar above every chart (zoom, pan, export to PNG). Weaknesses: defaults look like a research report, not a board pack. Heavier and slower to load than the others.
Use this when: you're exploring data, or you need a chart type the others don't have.
5. D3
D3 is the foundation everything else is built on. Recharts uses it under the hood. Chart.js was partly inspired by it. It's not really a charting library, it's a toolkit for drawing things based on data, which means you can build charts that don't exist anywhere else: custom radial layouts, network graphs, weird hybrid visualisations, anything you've seen on the Financial Times or Economist.
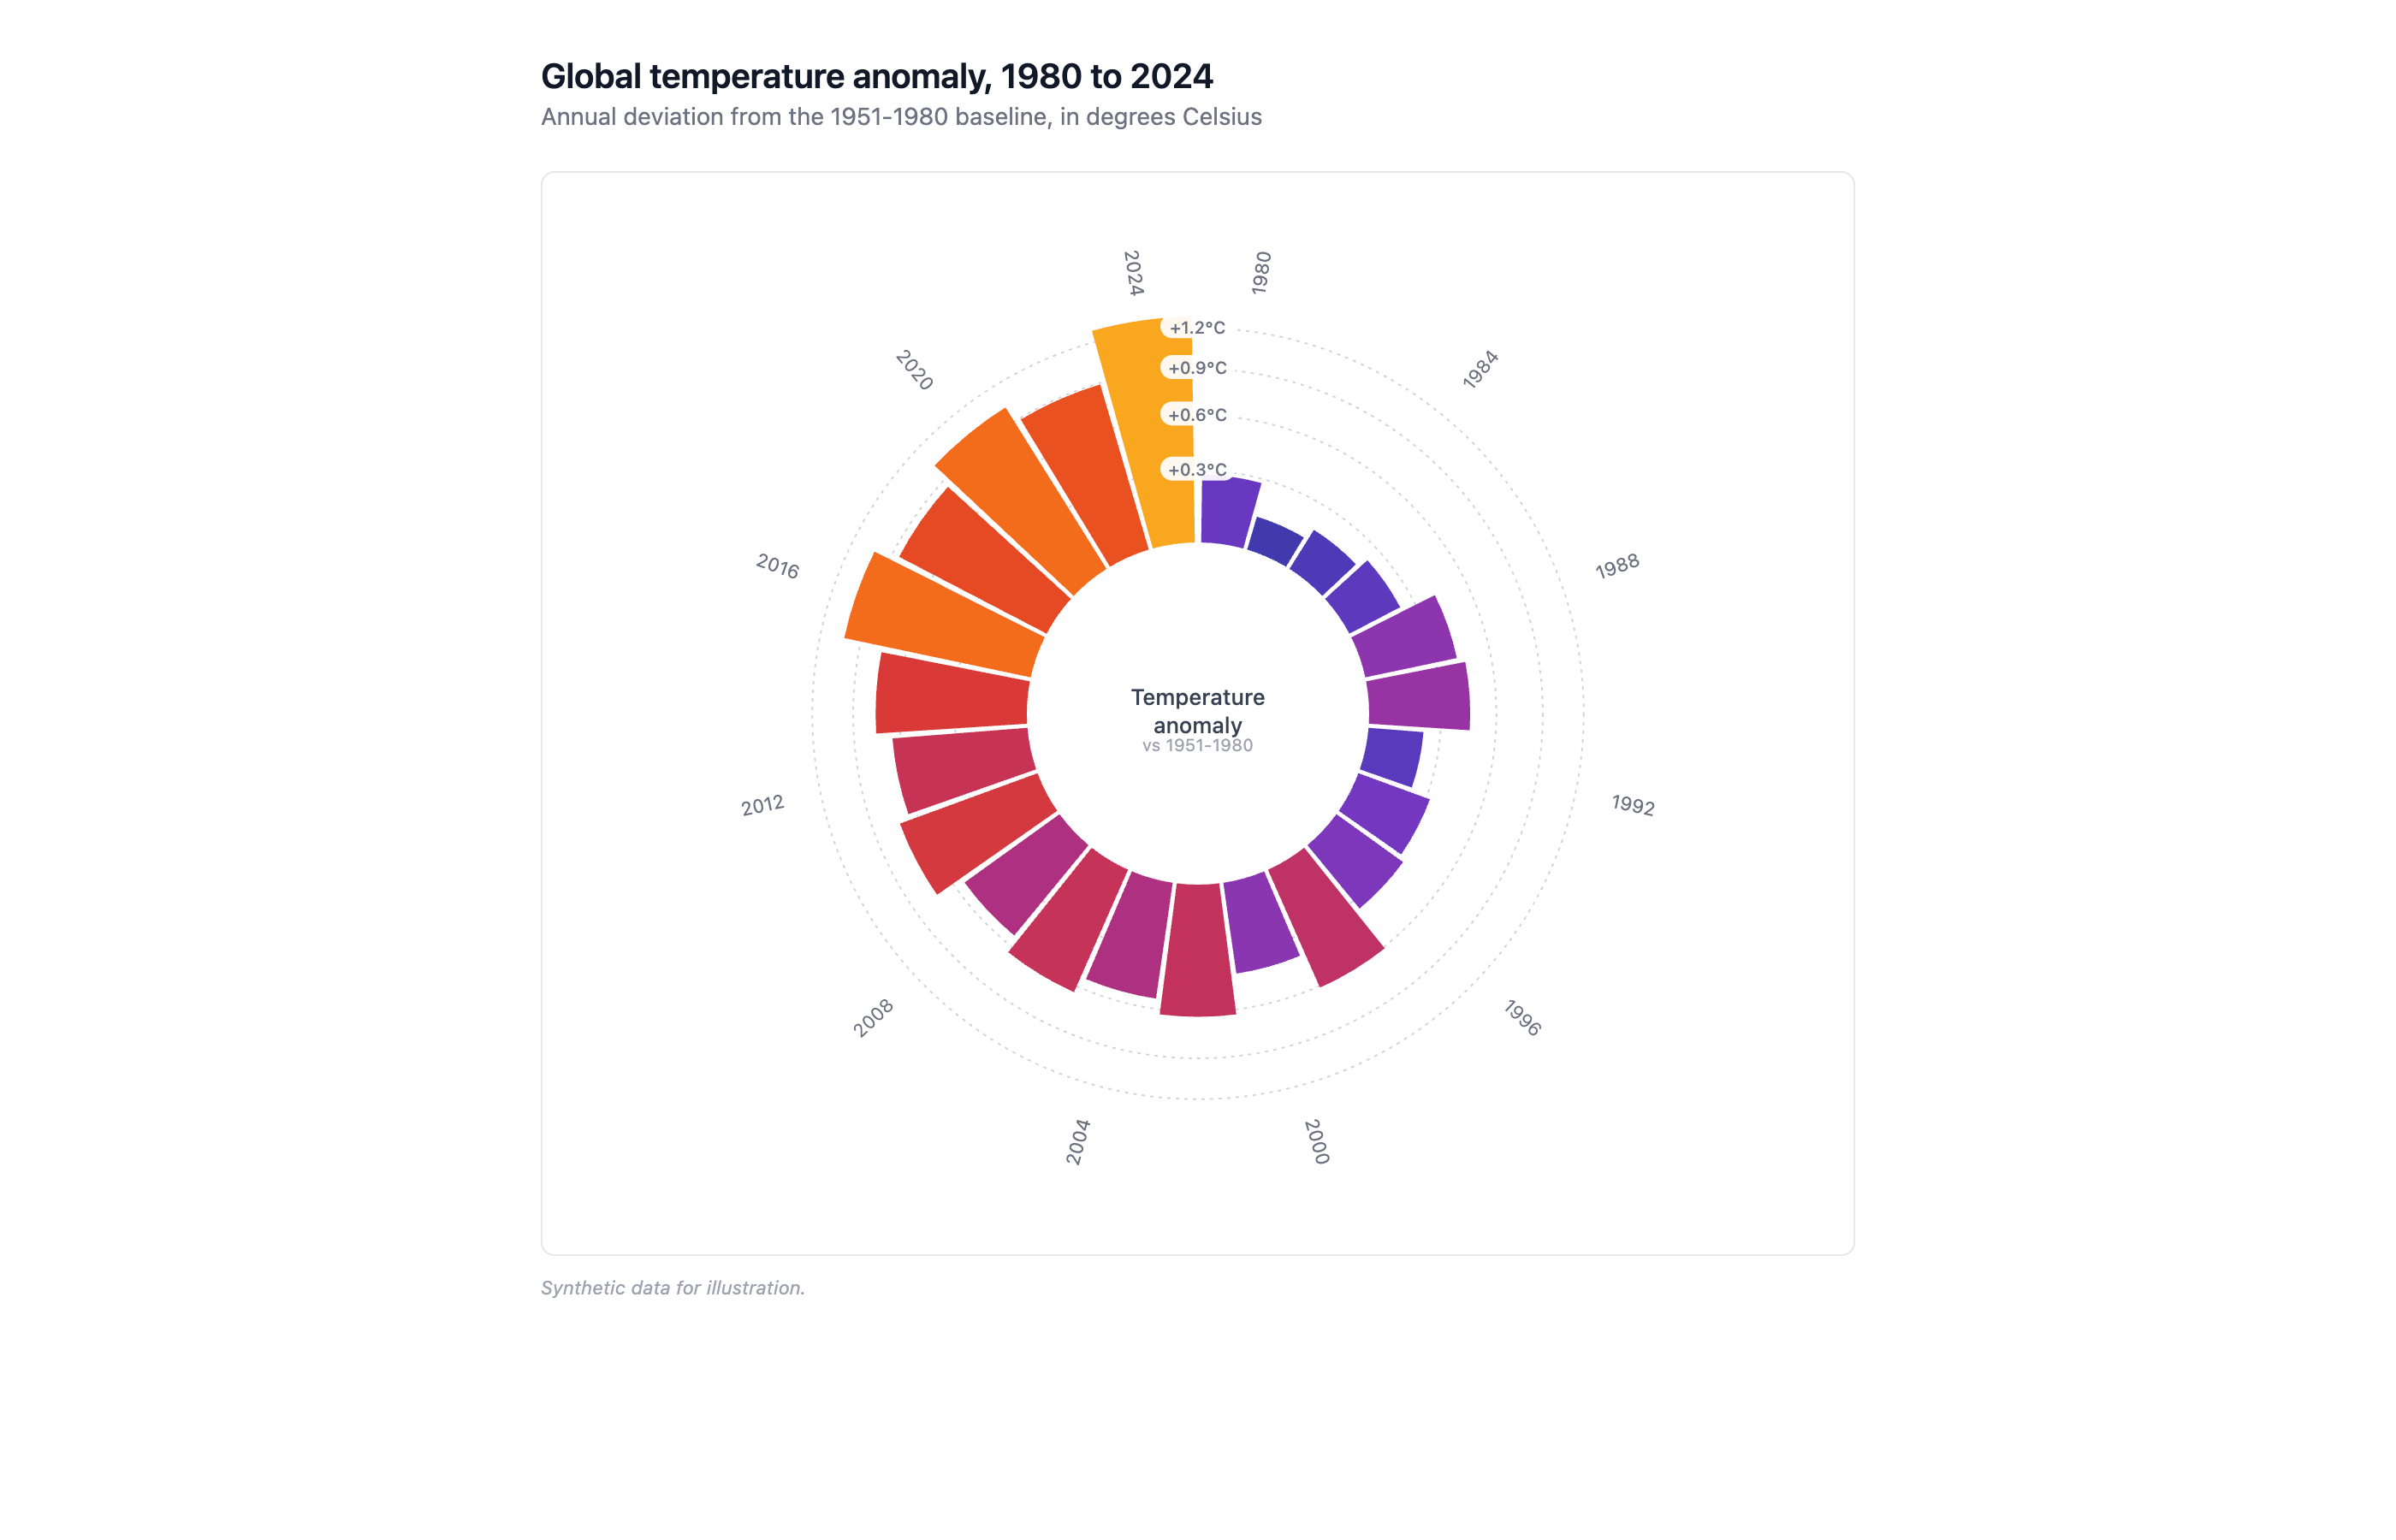
Strengths: can build literally any chart you can imagine, including ones that don't exist in any other library. Weaknesses: much more code, more chances for Claude to get something wrong, slower to iterate. Anything more than a static chart (hover, tooltip) has to be built from scratch.
Use this when: nothing off-the-shelf does the job.
6. Native PowerPoint, Word, and Excel charts
This one is widely known. When Claude creates a .pptx or .xlsx file (either via file creation in Claude.ai, or via the Claude for PowerPoint add-in) the charts inside are real native Office objects. You can click them, restyle them, re-bind them to new data inside PowerPoint. They are not static images.
Strengths: real Office chart objects you can edit outside Claude. Weaknesses: confined to Microsoft-native charting capabilities which are limited: e.g., no mekko, a basic waterfall, limited and clunky customization options etc.
Use this when: your final destination is PowerPoint or Excel and the charting you need falls inside Microsoft's native charting capabilities.
Claude vs ChatGPT for charts
Quick comparison because this comes up a lot.
ChatGPT generates charts mainly through its data analysis tool, which writes Python and produces matplotlib images. It now also has a "Switch to interactive chart" toggle for four types (bar, line, pie, scatter). Strongest at heavy data analysis on real datasets, because the Python interpreter is more mature than Claude's.
Claude generates charts mainly through artifacts, which run real interactive code (Recharts, Chart.js, Plotly, D3). Wider range of chart types, better-looking defaults, and Claude also has the inline option for quick visuals in the chat itself, which ChatGPT doesn't have an equivalent for.
For business chart users: if you're analysing a large dataset, ChatGPT is the better tool. If the chart itself is what you're shipping, Claude is.
The editing problem (and how we're solving it)
Once a chart exists in Claude, your options for changing it are narrow. Inside Claude, you edit by prompting. "Make the bars blue." "Add a trend line." Fine for one or two tweaks. Painful when you have ten. Slow and token-heavy. Outside Claude, there's no editing at all, except for charts that land as native Microsoft Office objects. But as indicated before, customization options are limited and clunky.
That's the gap. Claude can make great charts. Editing them is the hard part, and a lot of users are feeling it.
This is the problem we've spent the last year working on at Chartbuddy. We believe in a world of hybrid charting: get to your chart fast with one or two prompts, tweak, then push it to your deck where it stays fully editable. The Google Slides editor is already live. Chartbuddy for AI is launching soon: generate in Claude, push into Slides as a real Chartbuddy chart, keep tweaking inside the slide. A PowerPoint version is something we're considering next.