Chartbuddy's Google Sheets sync lets you connect any chart to a spreadsheet so your presentations always reflect the latest data. This is especially useful for recurring reports, monthly decks, and dashboards.
How to link a chart to Sheets
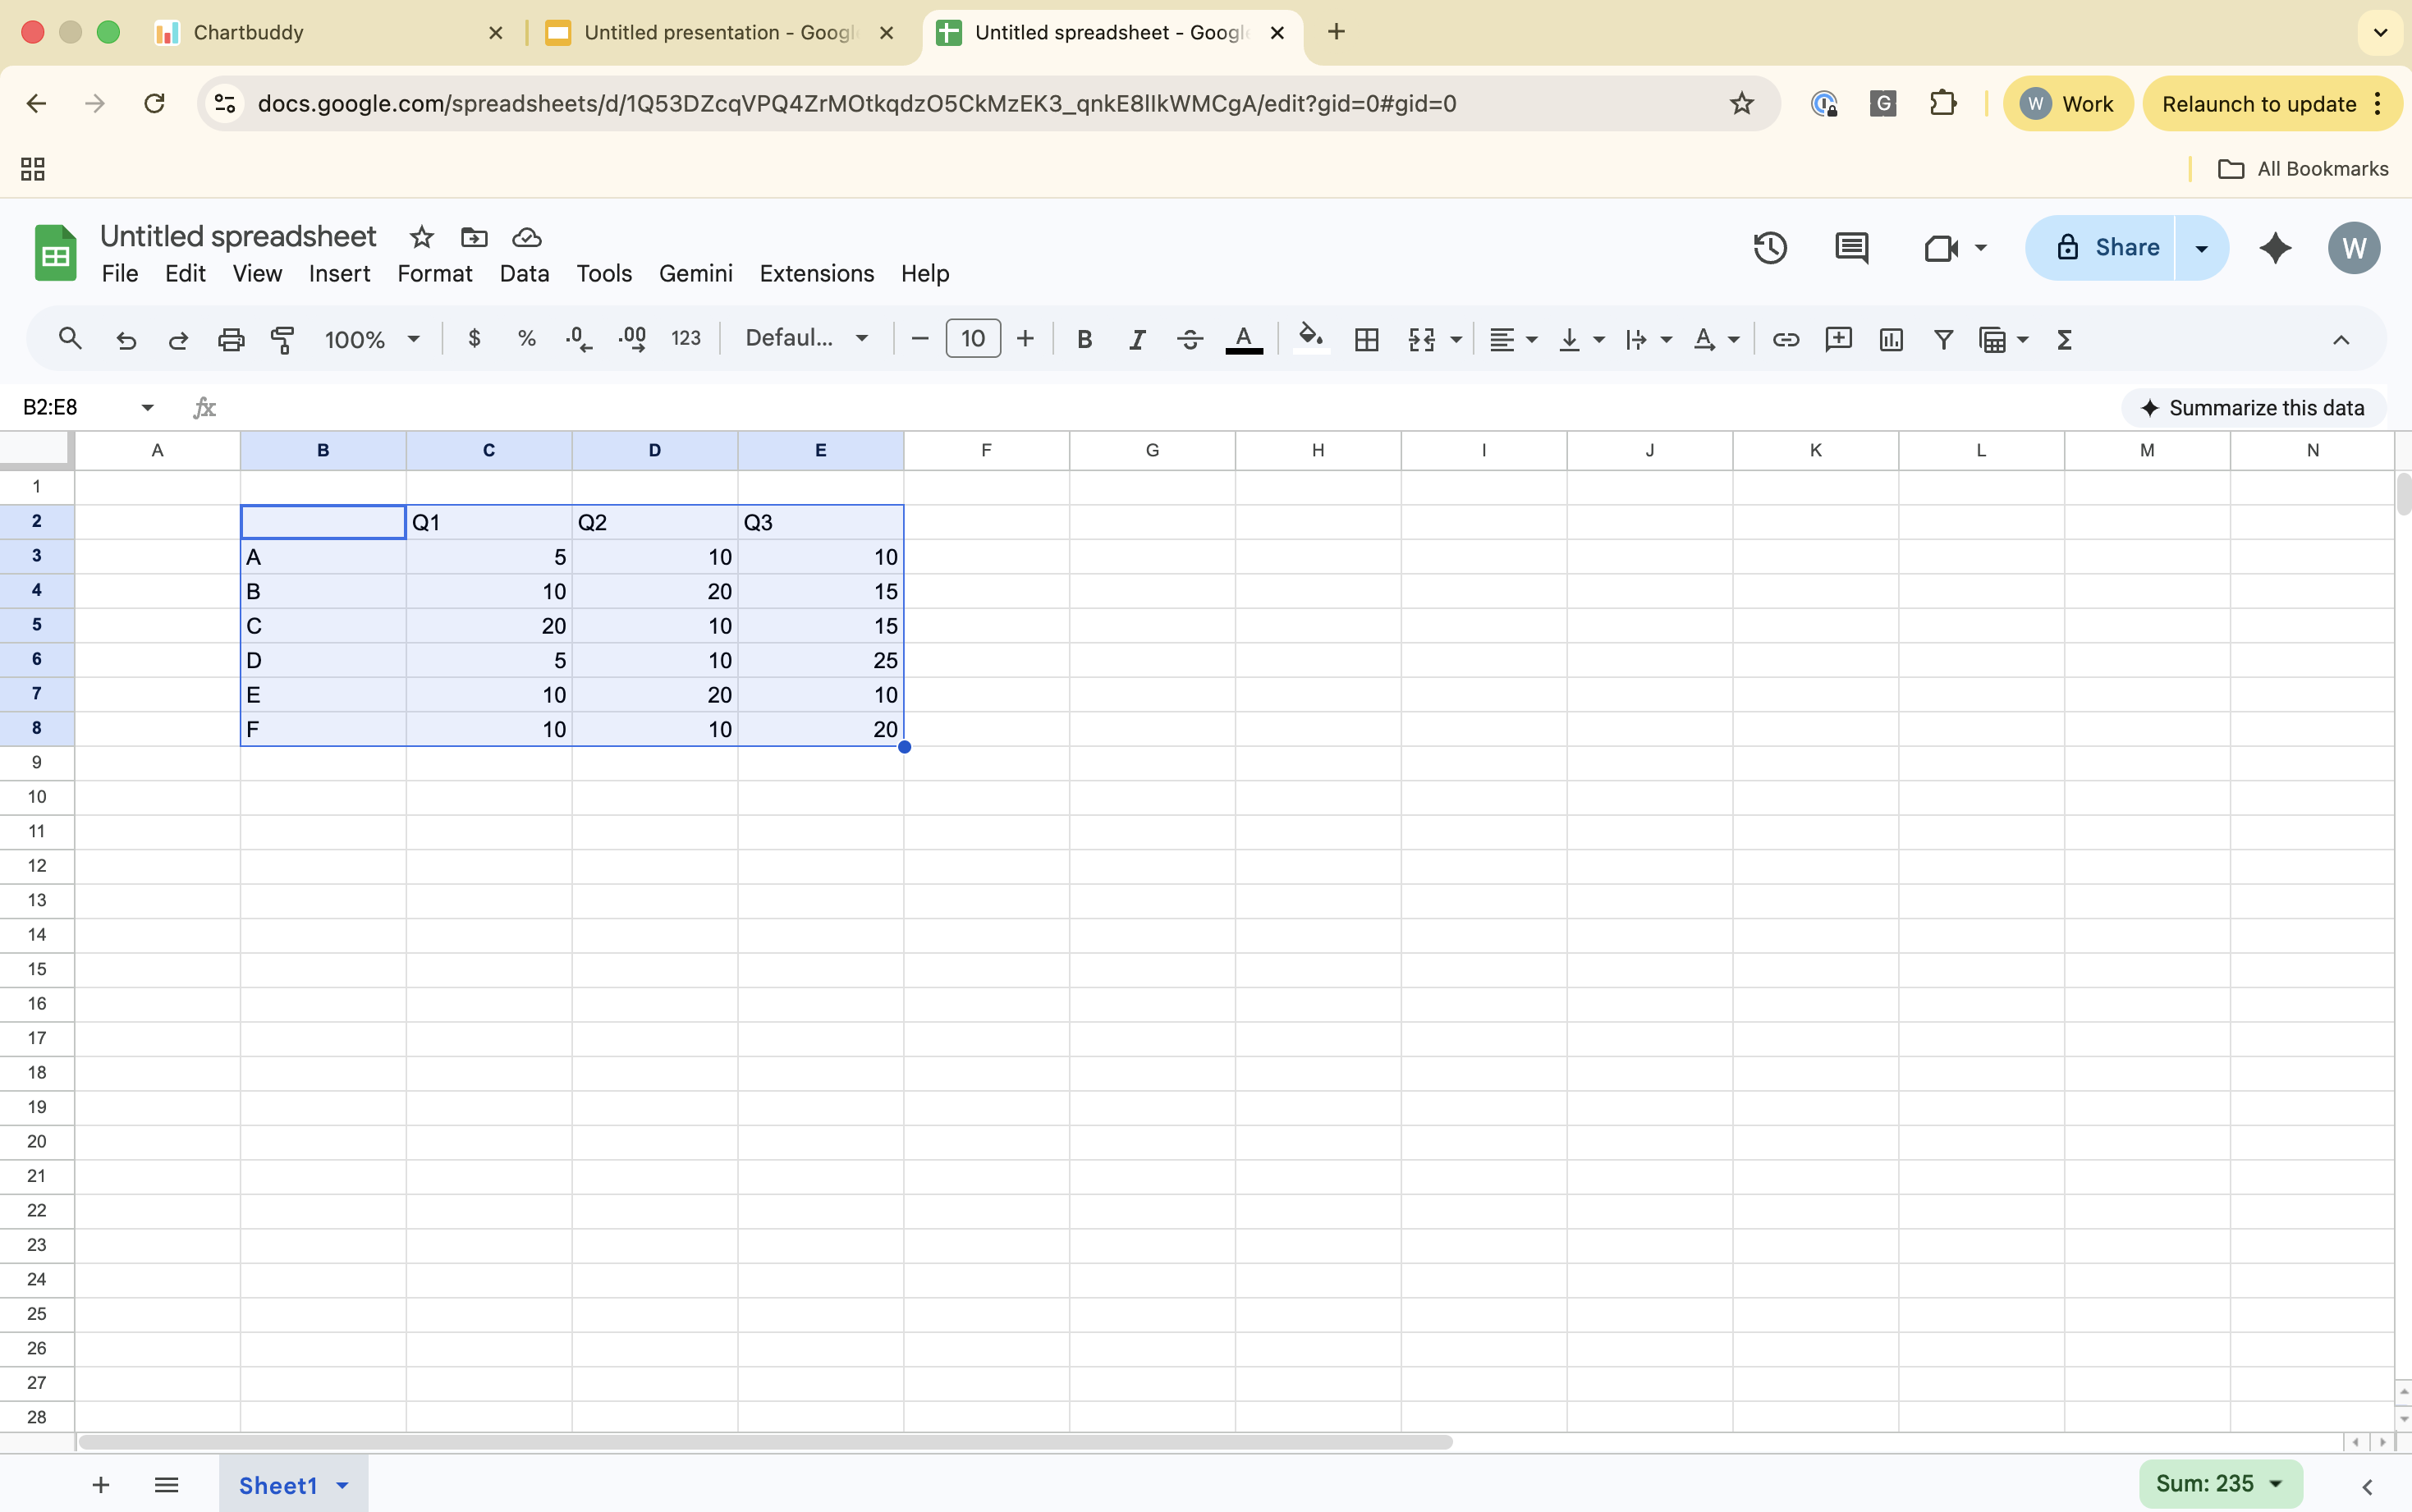
- Open your Google Sheets file and select the cell range you want to use for the chart
- Switch to your Google Slides presentation and open Chartbuddy
- Create or select a chart
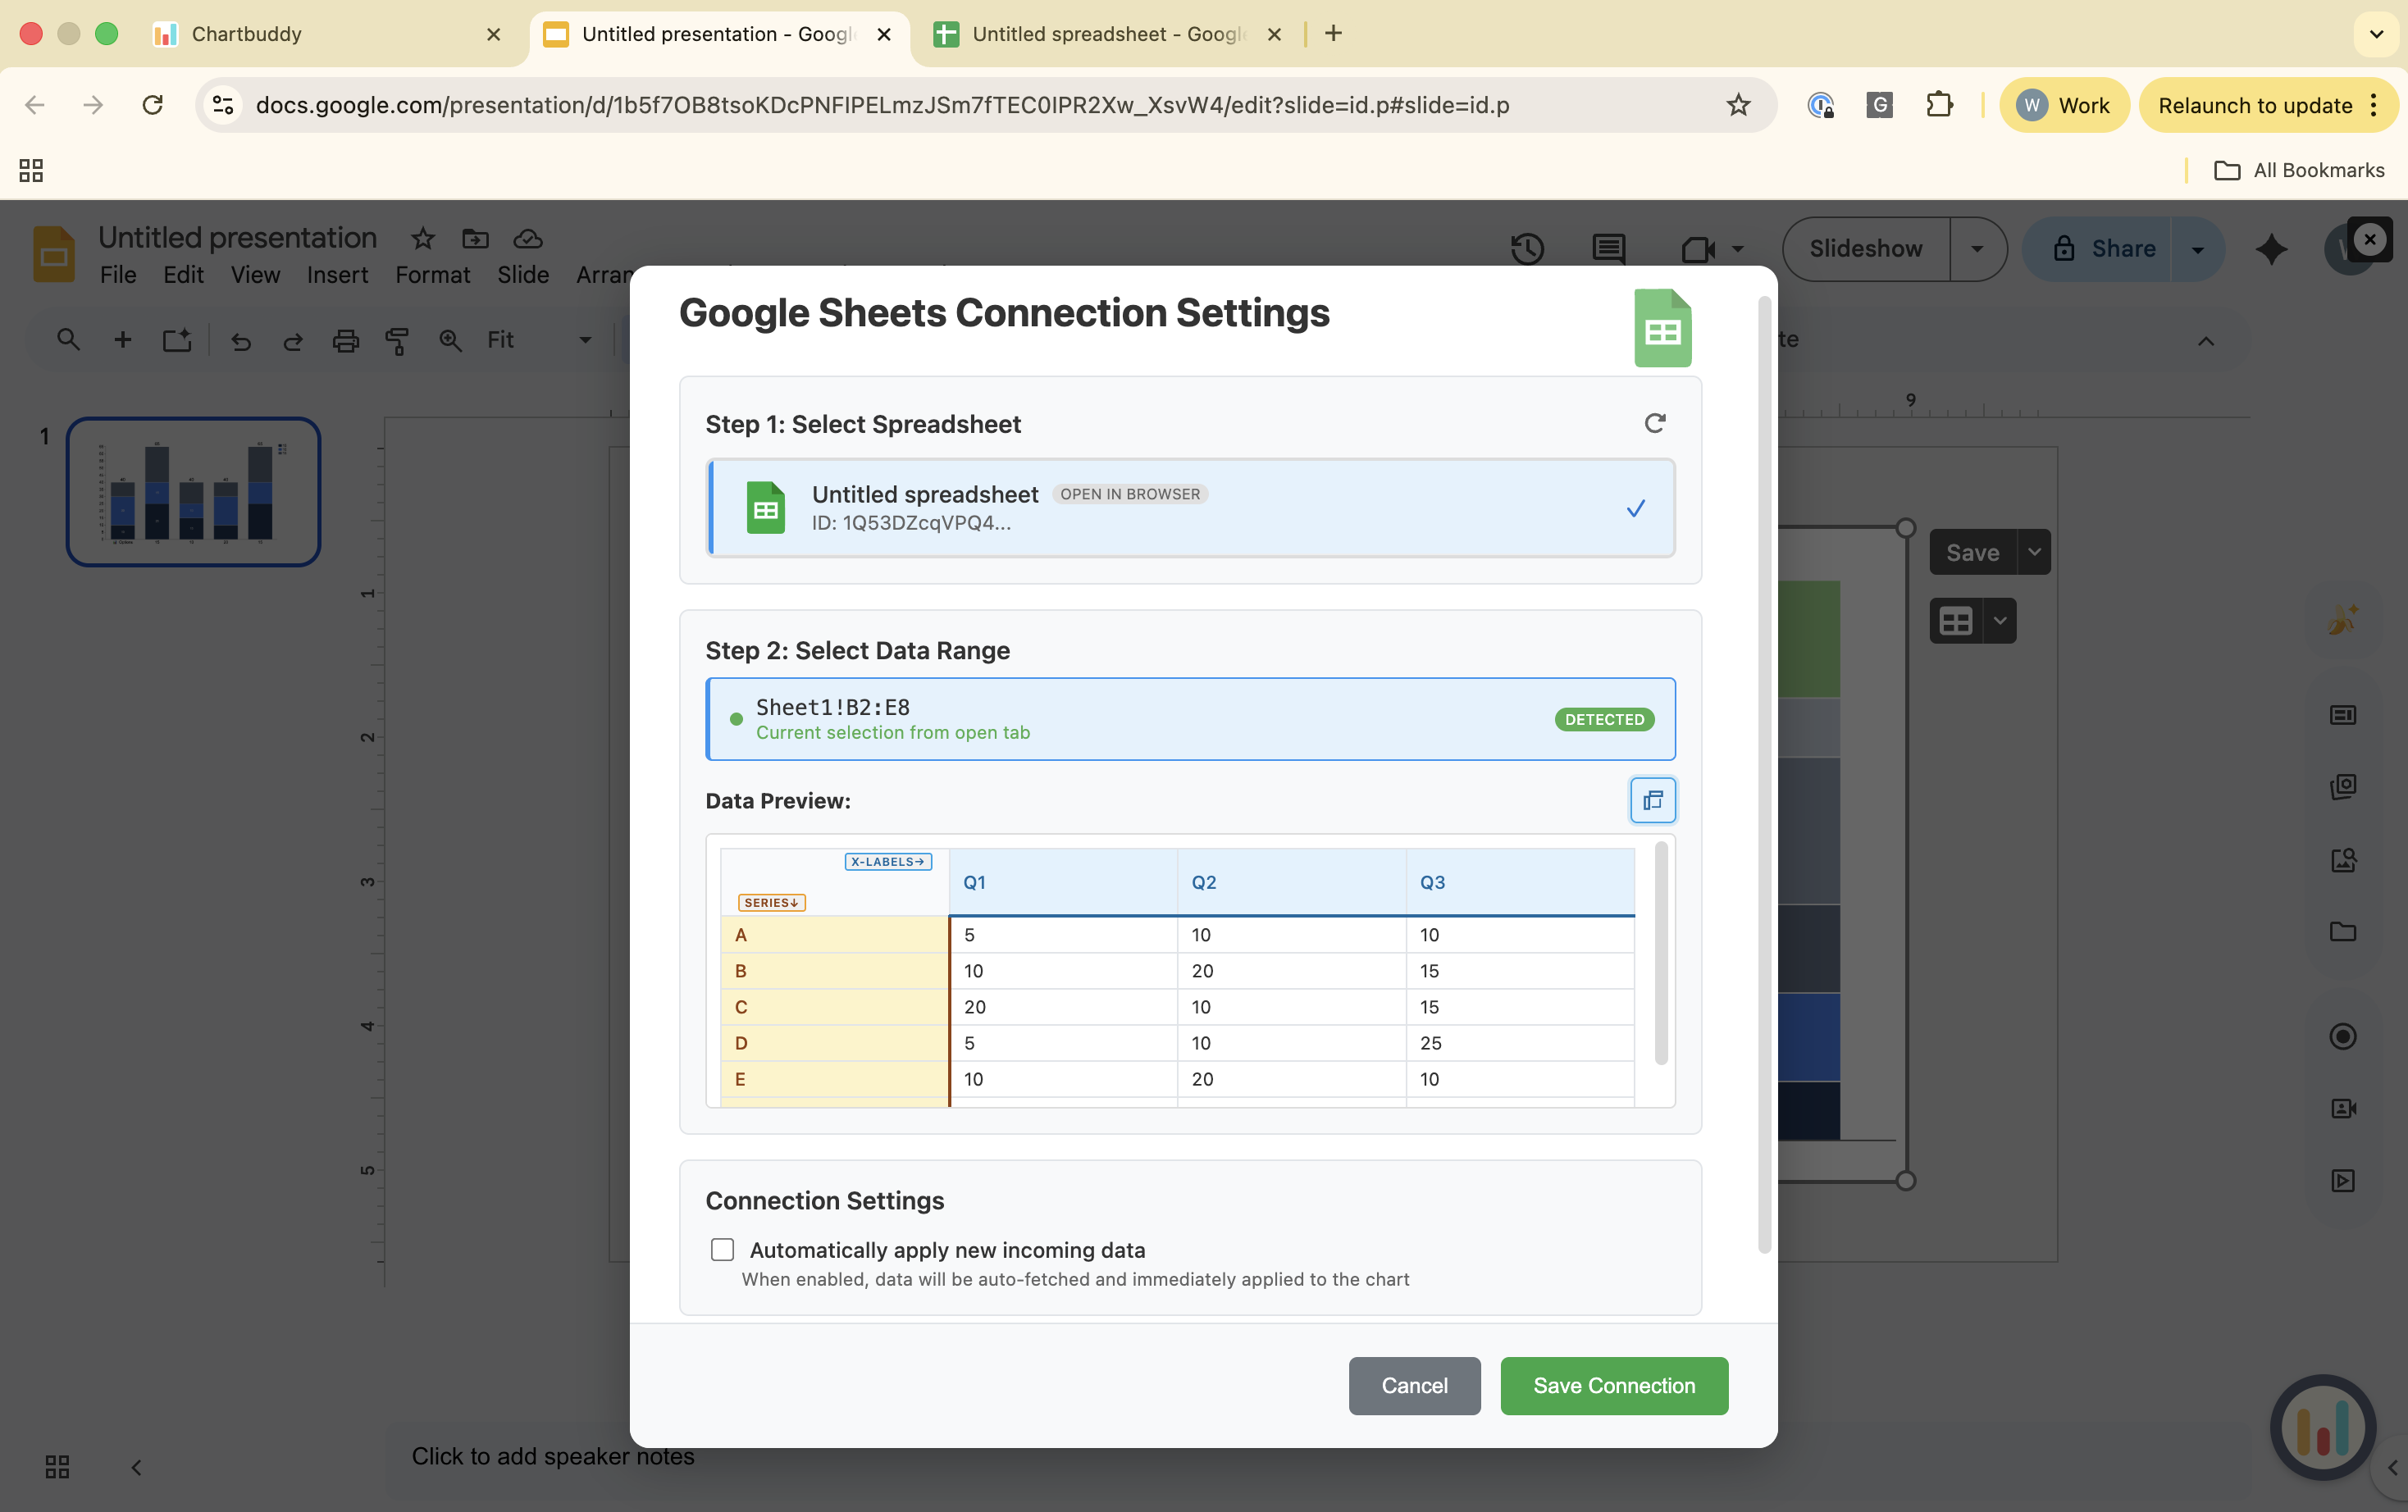
- Click the link option to connect to Google Sheets
- Chartbuddy automatically fetches the data from your pre-selected range
- Accept, and your chart is linked
Auto-update vs manual refresh
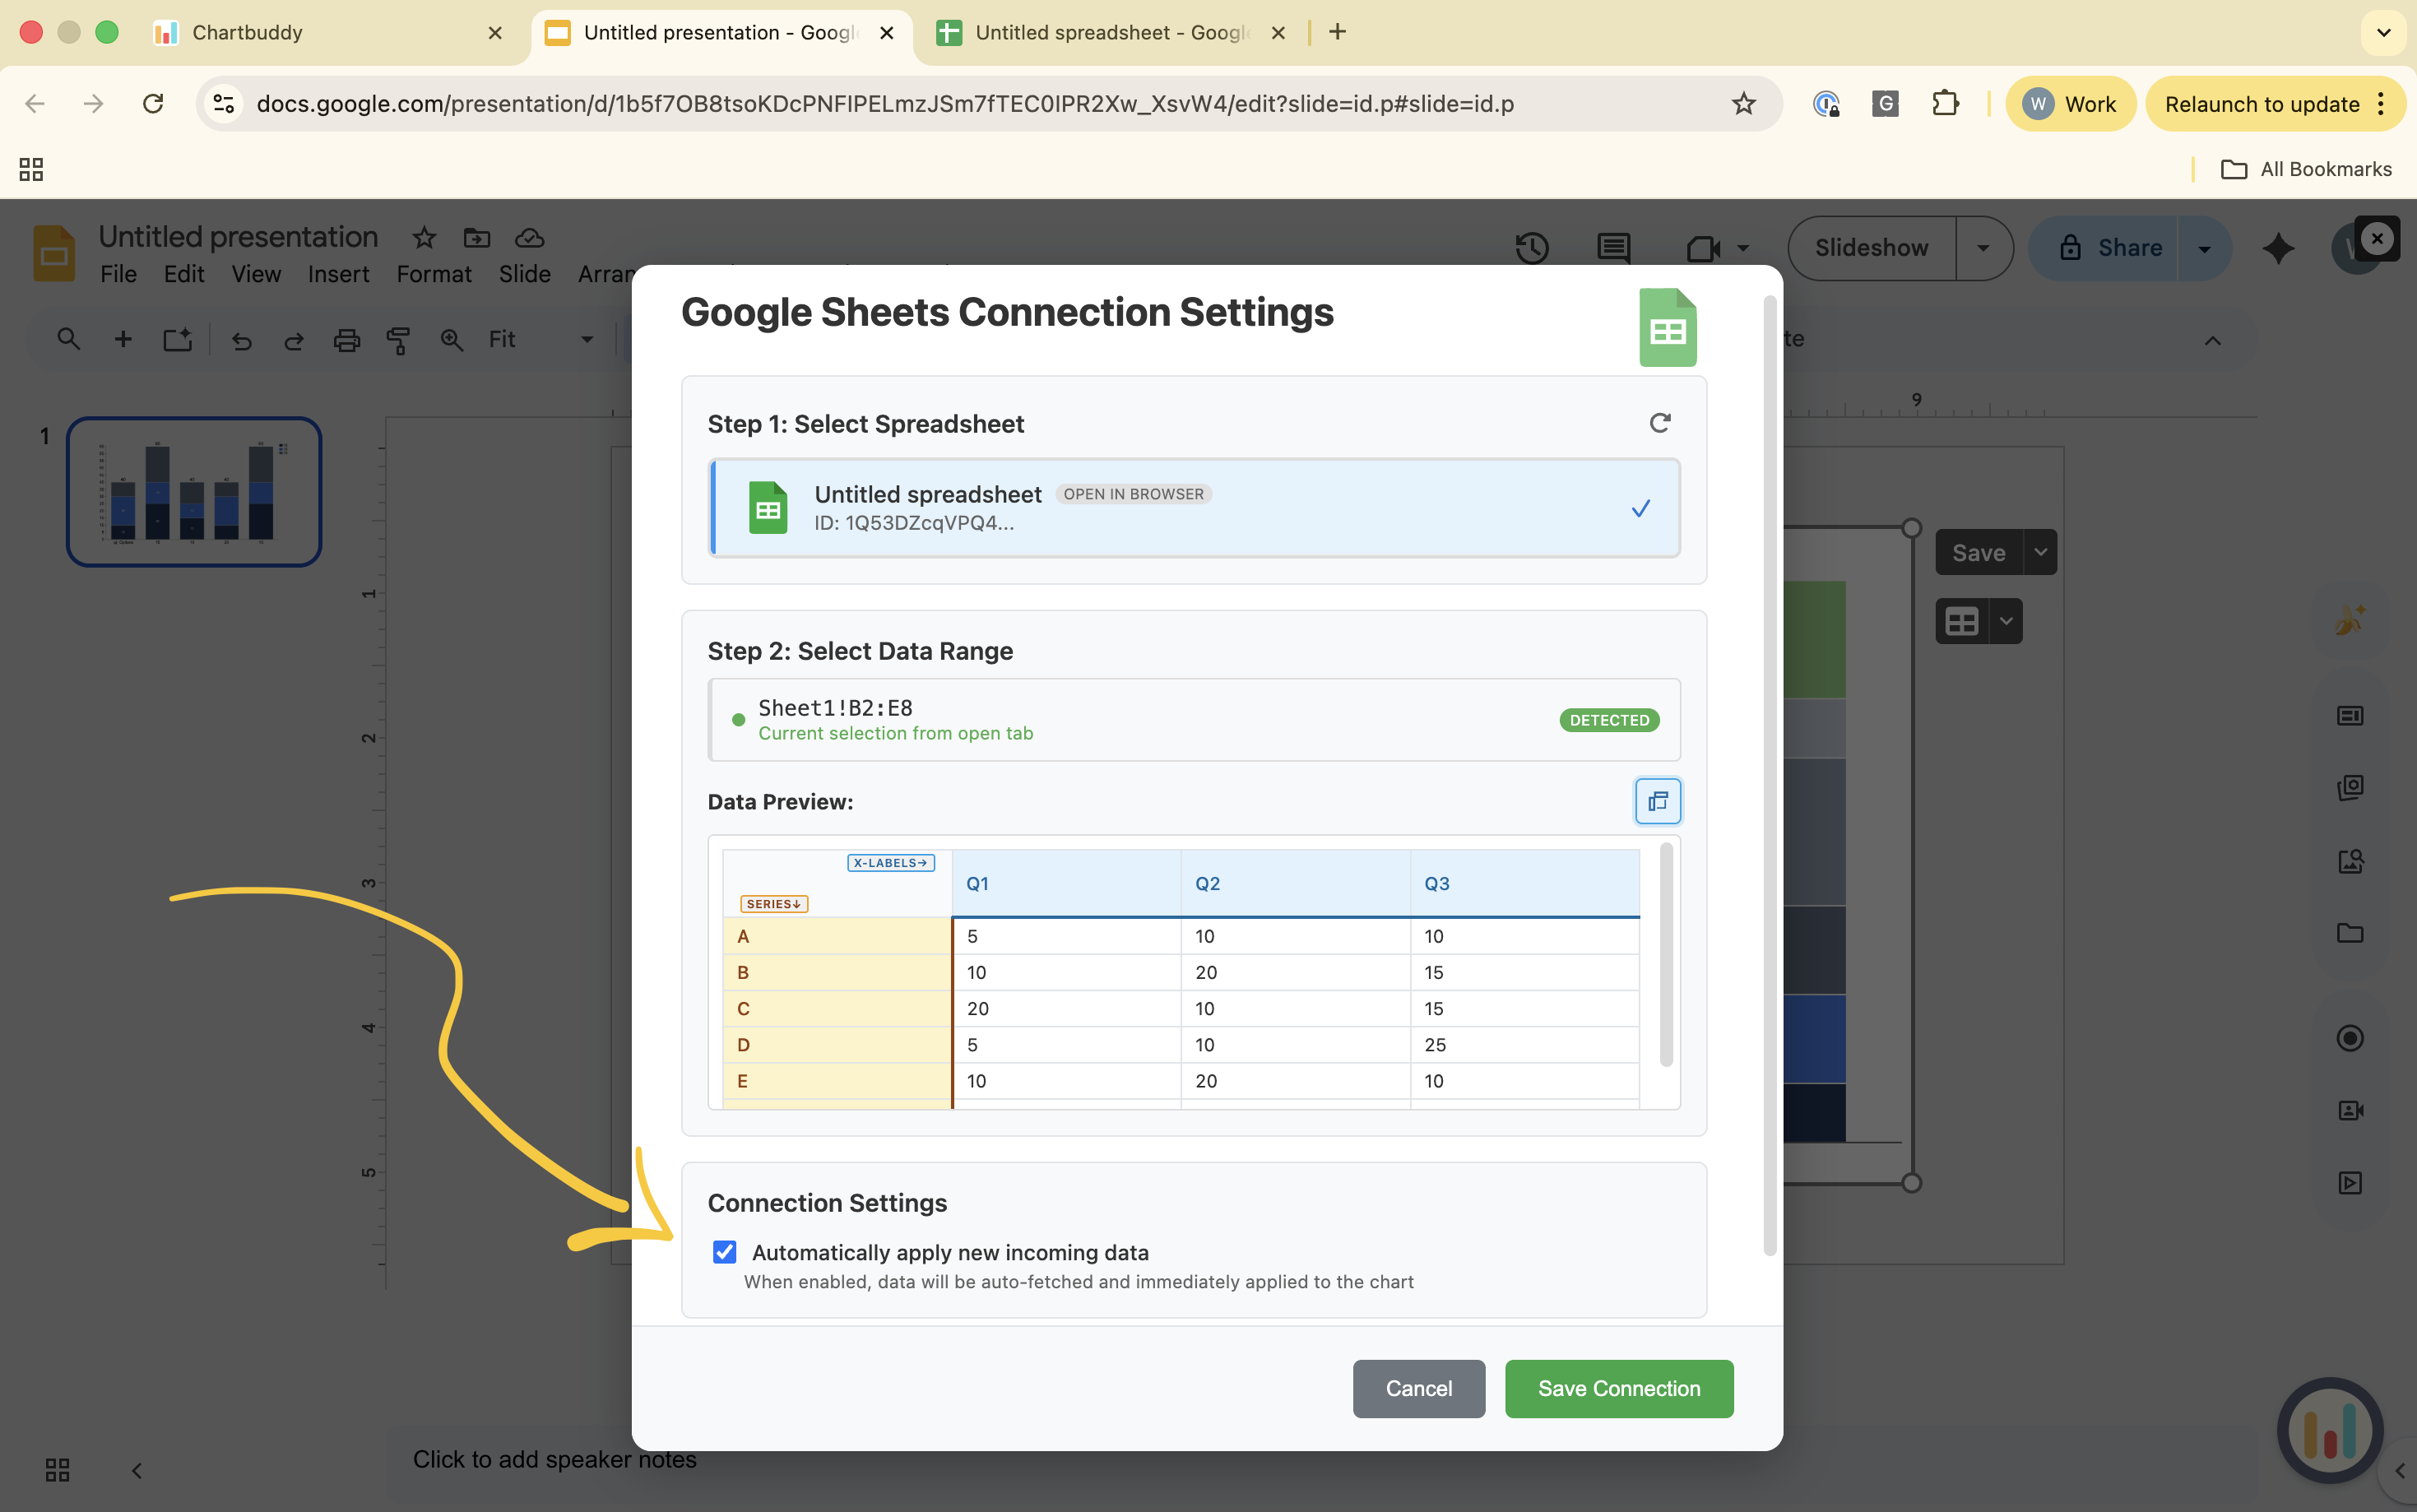
You have two options for keeping your chart in sync. Both are configured in the same menu where you select your sheet and range.
Auto-update: Toggle auto-update on in the sheet/range selection menu. Chartbuddy refreshes the chart data automatically when the presentation is opened. Best for dashboards and reports that always need to show the latest numbers.
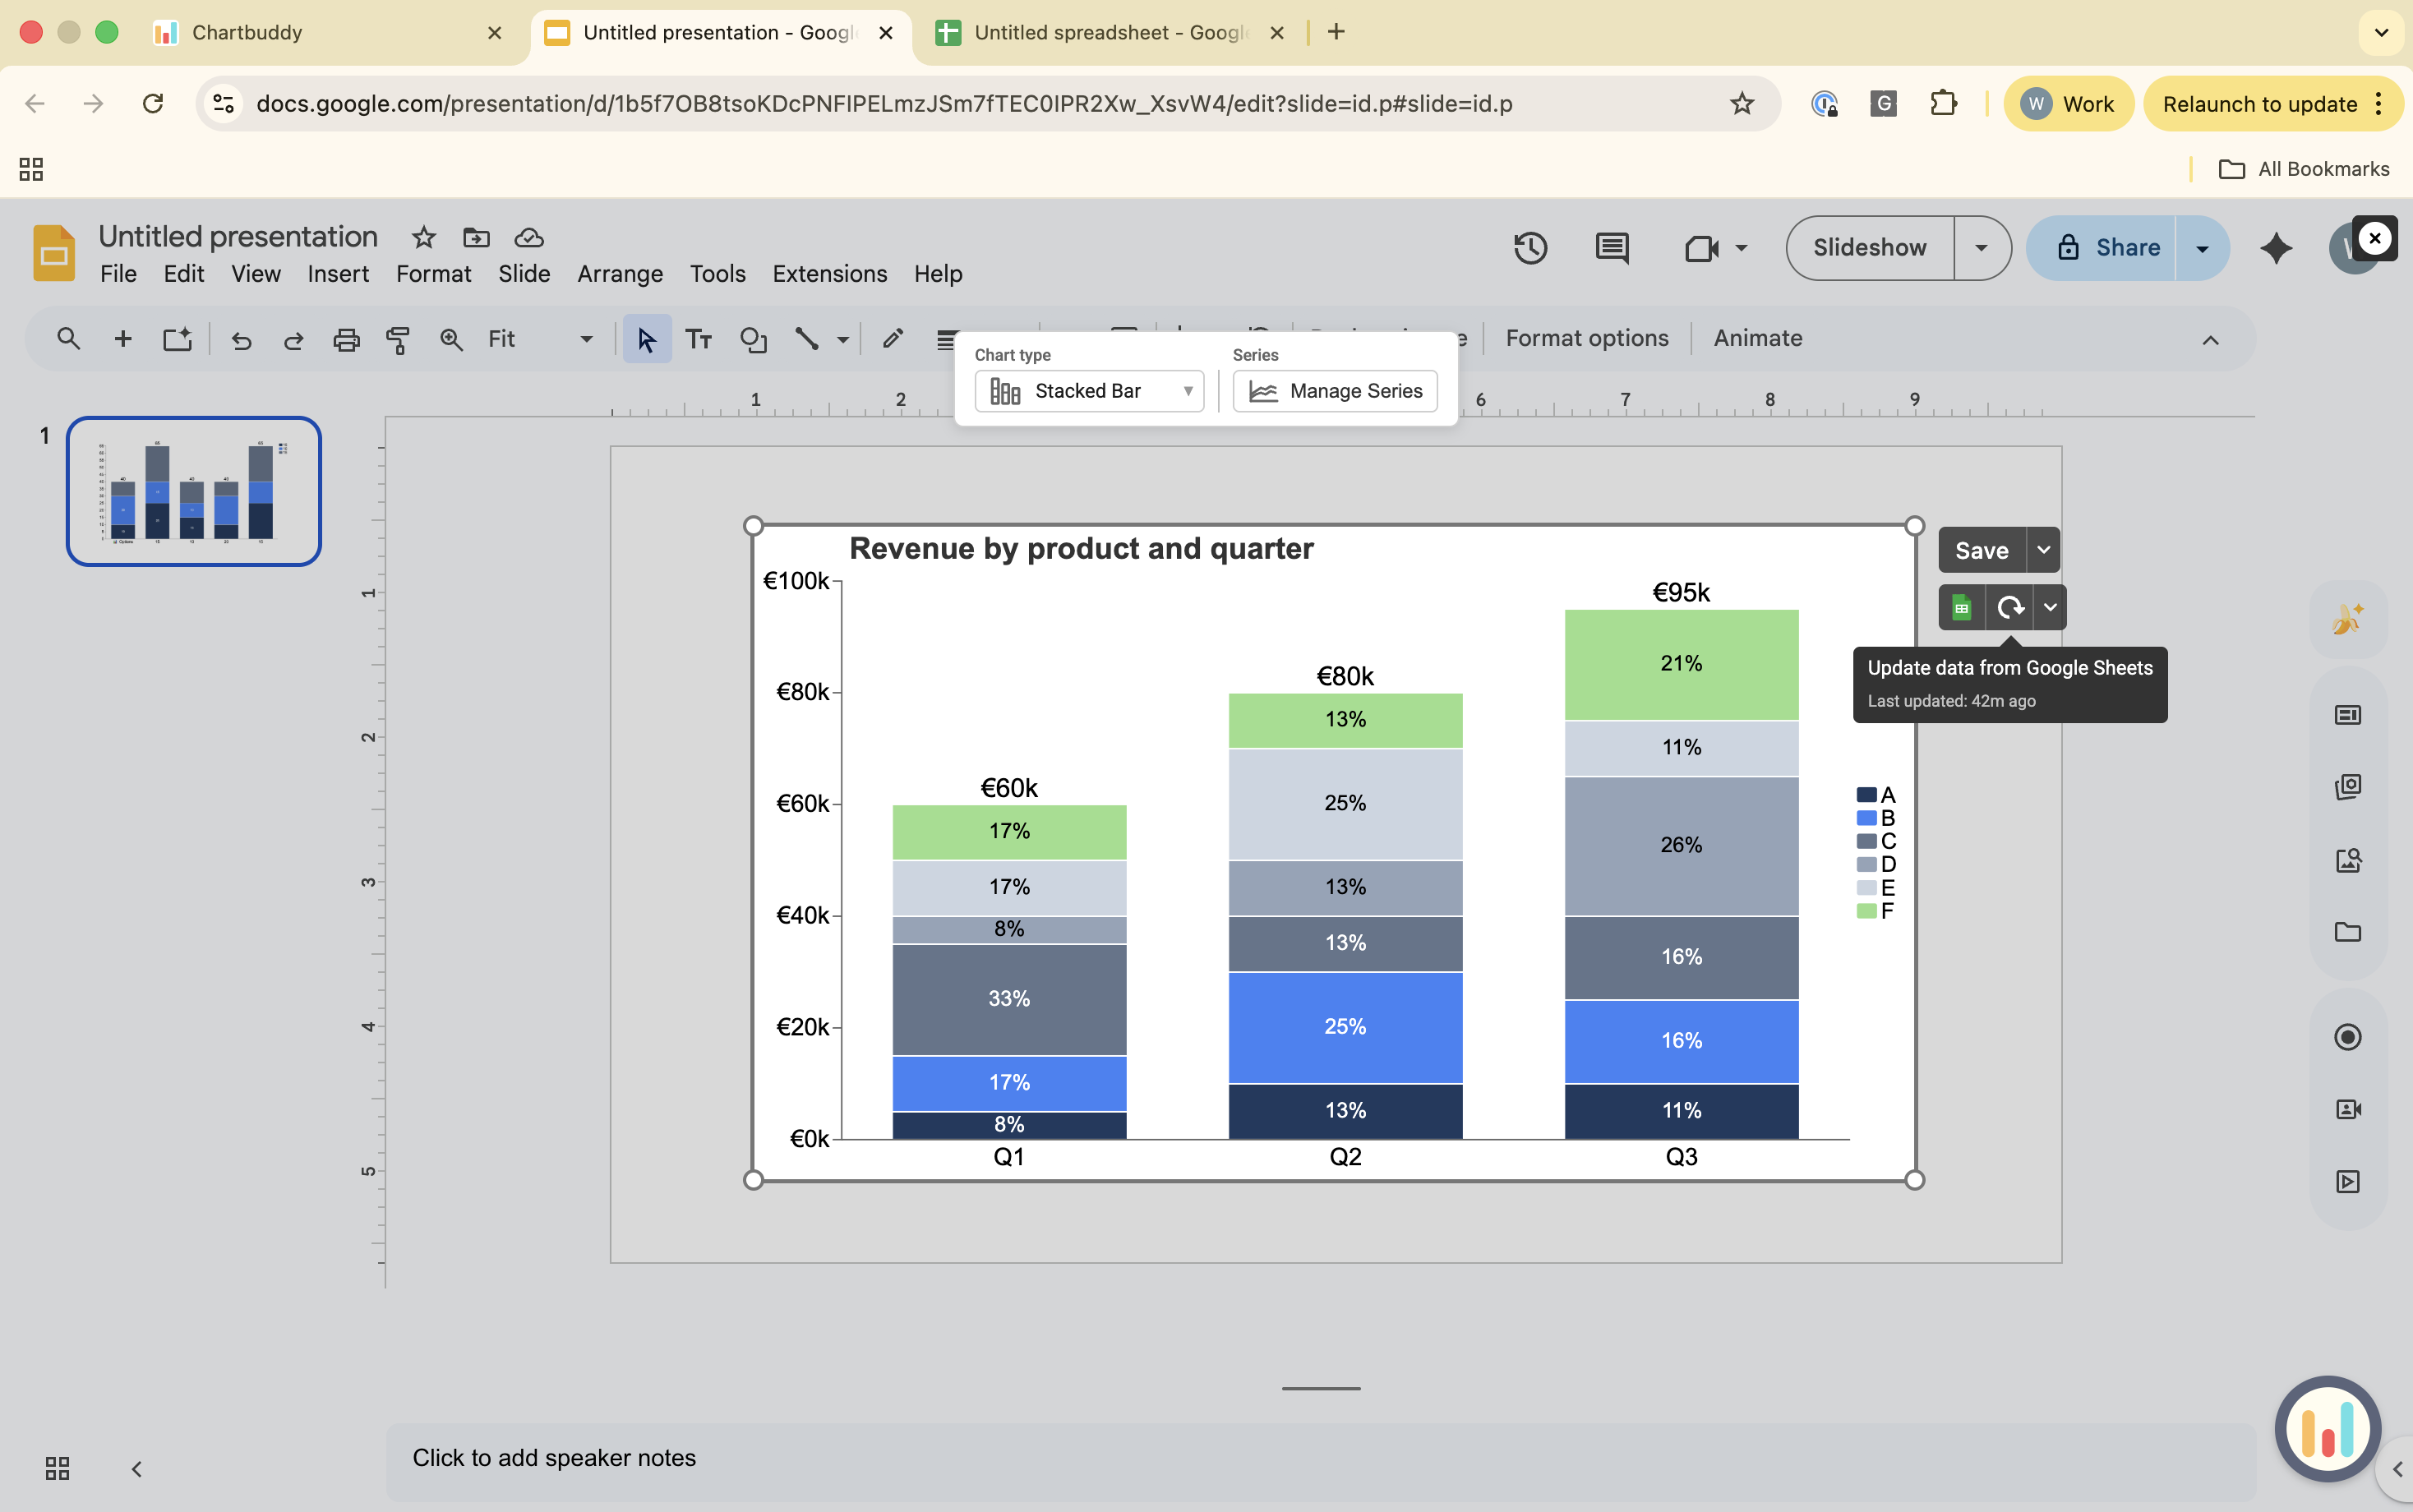
Manual refresh: Click the refresh button next to the Google Sheets logo to pull the latest data on demand. Best when you want to control exactly when data updates - for example, before a board meeting.
Tips
- You can link multiple charts in the same presentation to different Sheets ranges
- If you move or rename the linked spreadsheet, the connection stays intact as long as the file isn't deleted
- The linked spreadsheet must be accessible to the user viewing the presentation for sync to work