Appearance
Chart defaults
Chart defaults are your house style for charts: the colors, fonts, titles, legend, labels, axes and gridlines every new chart starts with. Set them once, and every chart you, a colleague or the assistant makes looks on-brand without restyling it by hand.
The same chart defaults work everywhere you use Chartbuddy: in Hub, in the Chartbuddy extension for Google Slides and in PowerPoint.
What a set contains
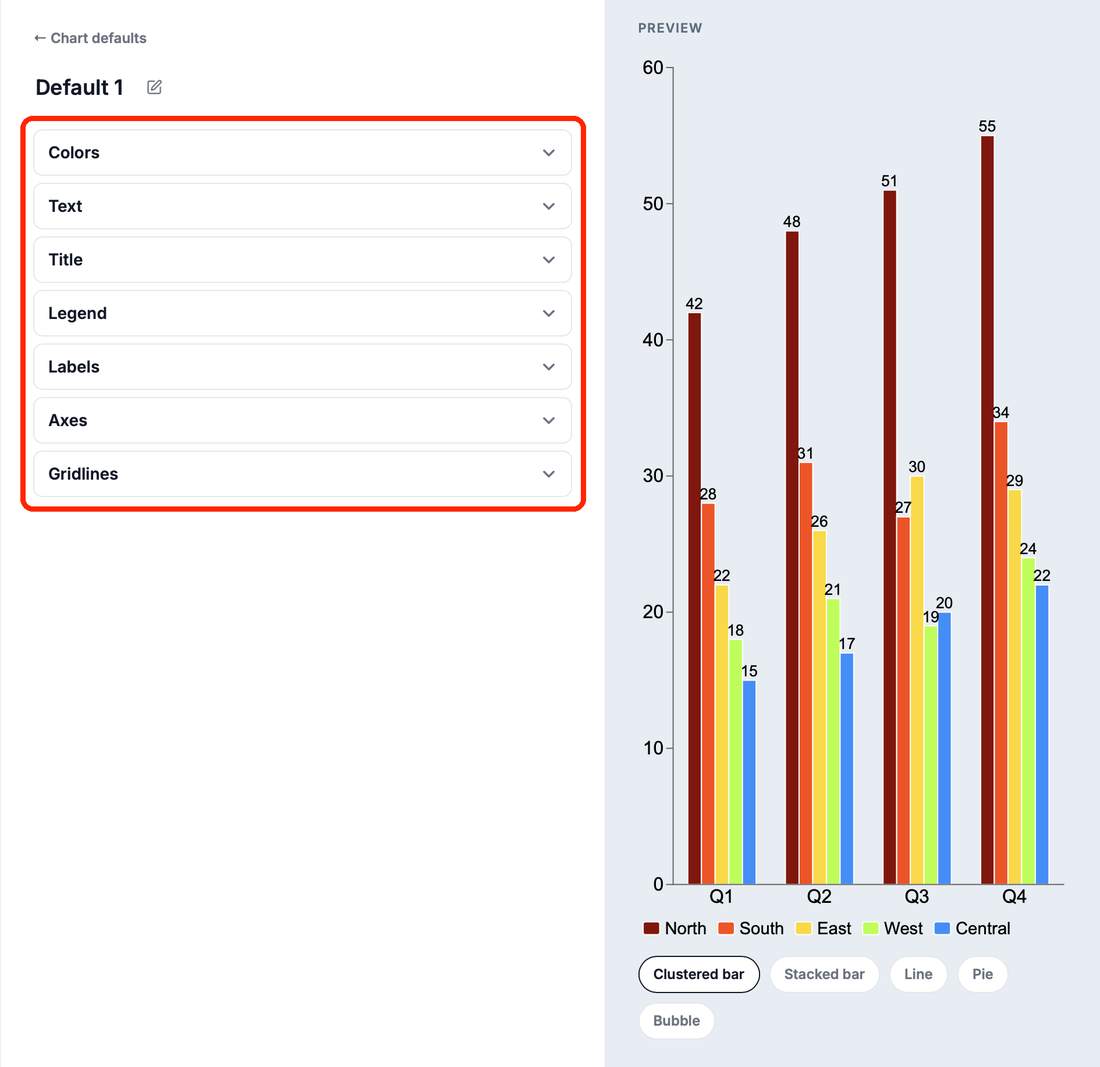
You can keep several sets of chart defaults, for example one per client or per report. Each set has seven parts:
| Part | What you set |
|---|---|
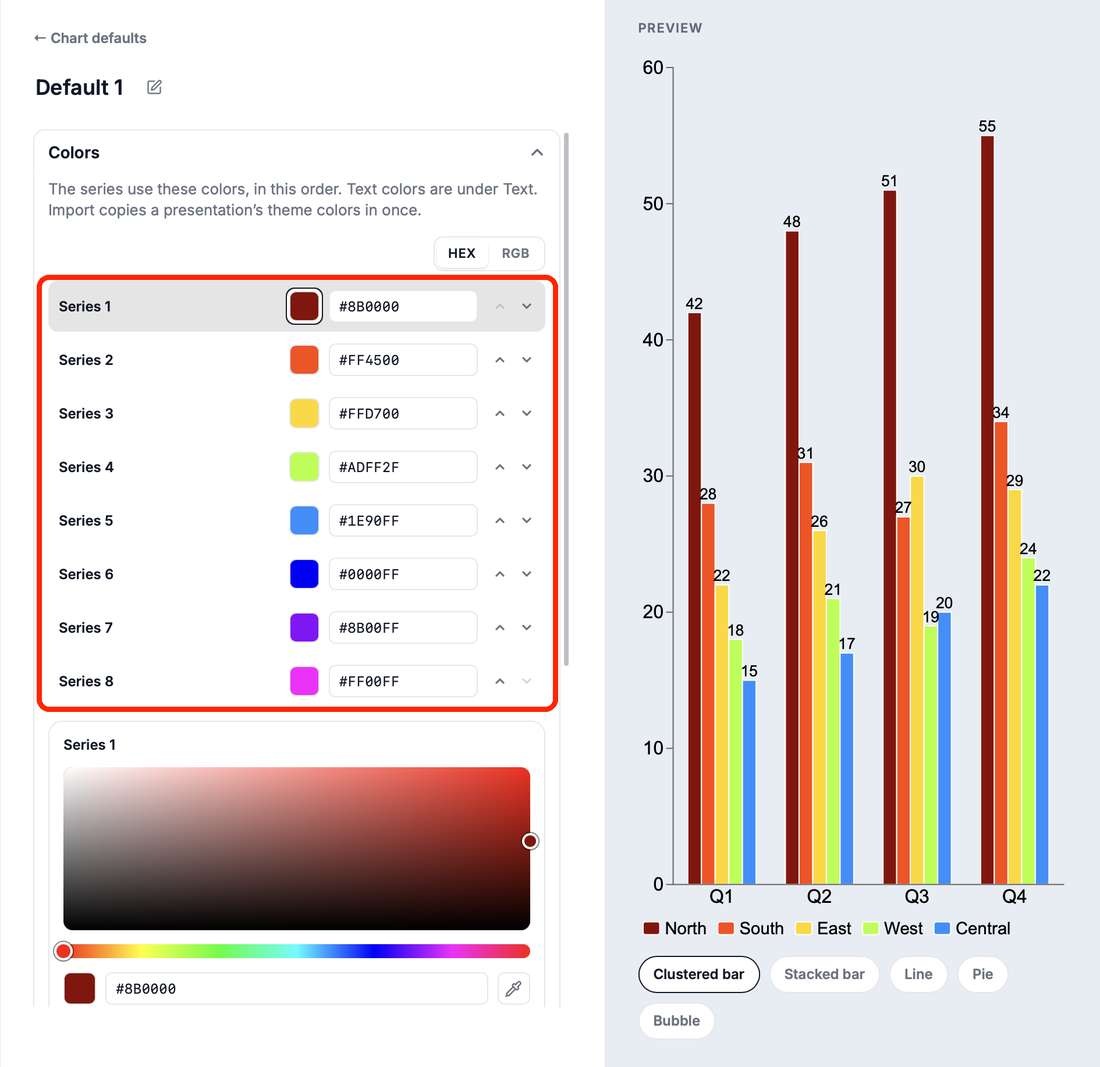
| Colors | The eight series colors, in order. Import takes them from a presentation's theme. |
| Text | The body and heading font, and the size and color of the text on each part of the chart. Import takes the font from a presentation. |
| Title | Whether the title and subtitle show, and how they look. |
| Legend | Whether the legend shows, and where. |
| Labels | Data labels and total labels, and their number format. |
| Axes | Which axes show, with their labels and ticks. |
| Gridlines | Which gridlines show. |
A set only holds what you change. Everything else keeps Chartbuddy's standard look.
Who a set belongs to
| Level | Who uses it | Who can change it |
|---|---|---|
| Personal | Only you | You |
| Organization | Everyone in your organization | Organization admins, and the members the admin setting Who can change templates, chart defaults, fonts and colours allows (by default everyone) |
| Project | The project's members | The project owner and administrators |
| Template | Decks made from one presentation template | The project owner and administrators |
Your organization starts with one organization set, Default 1, made from your organization's brand colors and font.
Which set a new chart gets
- In a project's deck: the set chosen for the deck's template, if it has one; otherwise the project default; otherwise the organization default. This also applies when the chat or an AI app makes the chart.
- Elsewhere in Hub: the set marked Default on the Chart defaults page.
- In the Chrome extension: the set you pick in Create New Chart (see below).
An AI app can also ask for a set by name, or skip chart defaults for one chart.
When they are applied
Chart defaults are applied once, when a chart is created. Existing charts stay as they are: changing a set does not restyle charts you already made. To restyle an existing chart, change it in the chart window, or ask the chat or your AI app to apply the house style to it.
Set them up in Hub
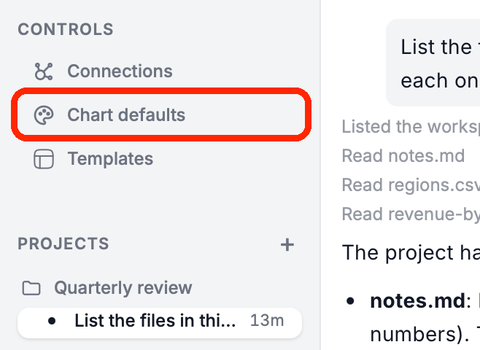
Open Chart defaults under CONTROLS in the sidebar.
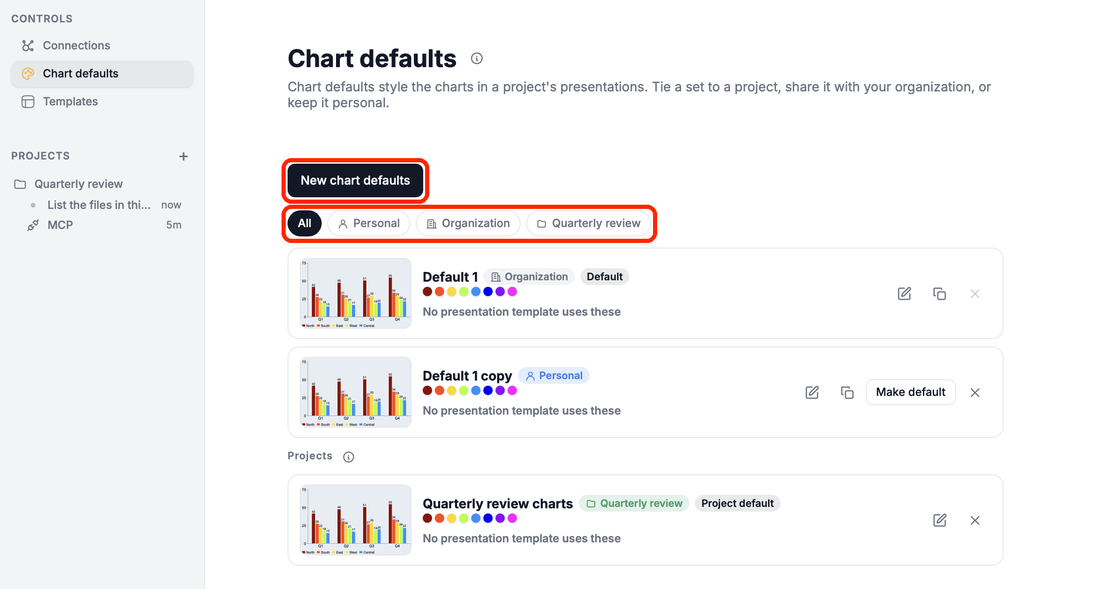
Click New chart defaults, or Duplicate an existing set to start from it. Organization sets you cannot change can still be duplicated into your own.
Go through the editor's steps, Colors to Gridlines. The preview shows the result.
Click Make default on a set to use it for new charts outside projects.
Filter the list with All, Personal, Organization or a project.
For a project
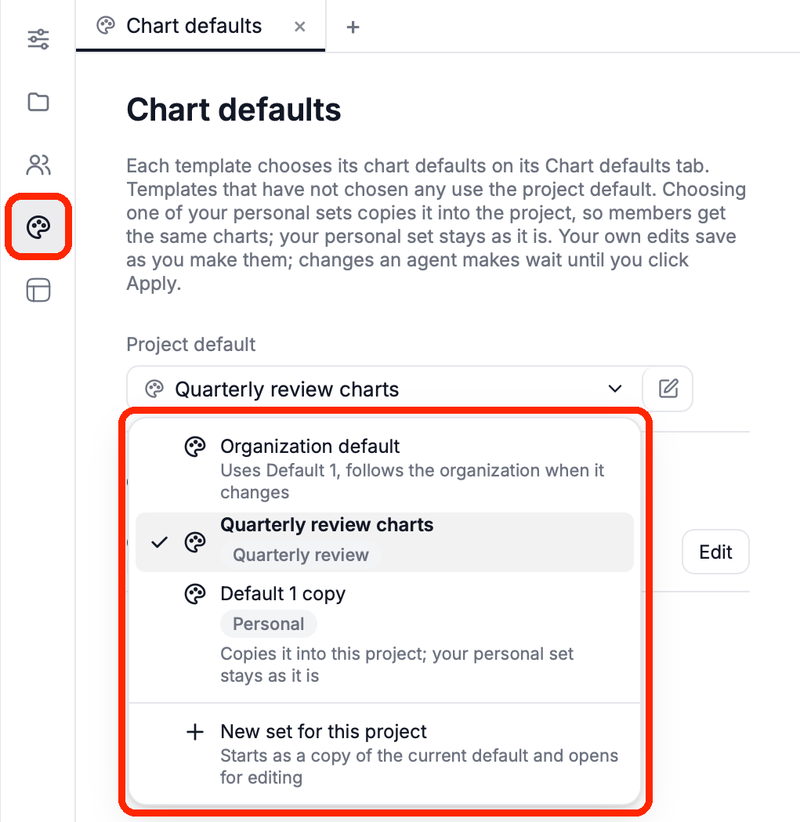
Right-click the project and choose Project settings, then click Chart defaults in the icon strip and choose the Project default: the organization default, one of your personal sets (Hub copies it into the project), or New set for this project. Chart defaults in use shows which templates use which set.
For one template
Open the template's guide and its Chart defaults tab. Choose chart defaults picks a set, or New set for this template starts a copy used by this template only. Edit opens the set on the Chart defaults page.
On the website
Your dashboard on chartbuddy.io has the same Chart defaults editor under Charts, open to every member. A set you make or duplicate there is a personal set. There you can also Import a Google font, which then shows up for everyone in your organization. Who may change the organization's set and fonts is the admin setting Who can change templates, chart defaults, fonts and colours under the organization's Settings (by default Everyone).
In the Chrome extension
In Google Slides, the Chartbuddy extension's Create New Chart window has a Chart defaults menu at the top. Pick the set the new chart starts with; each set shows whether it is Personal, Organization or a project's. Choose None for a Plain chart. Manage opens the Chart defaults page on the website.
Sets you make in Hub, on the website or in the extension are the same sets, so a change in one place shows up in the others.
Related
- Set a chart default set for use with a client – a project with its own chart defaults, start to finish
- Set chart defaults for my organization – style the organization set everyone starts from
- Ensure only admins can change chart defaults – lock the organization set and keep project roles tight