
Appearance
Set chart defaults for my organization
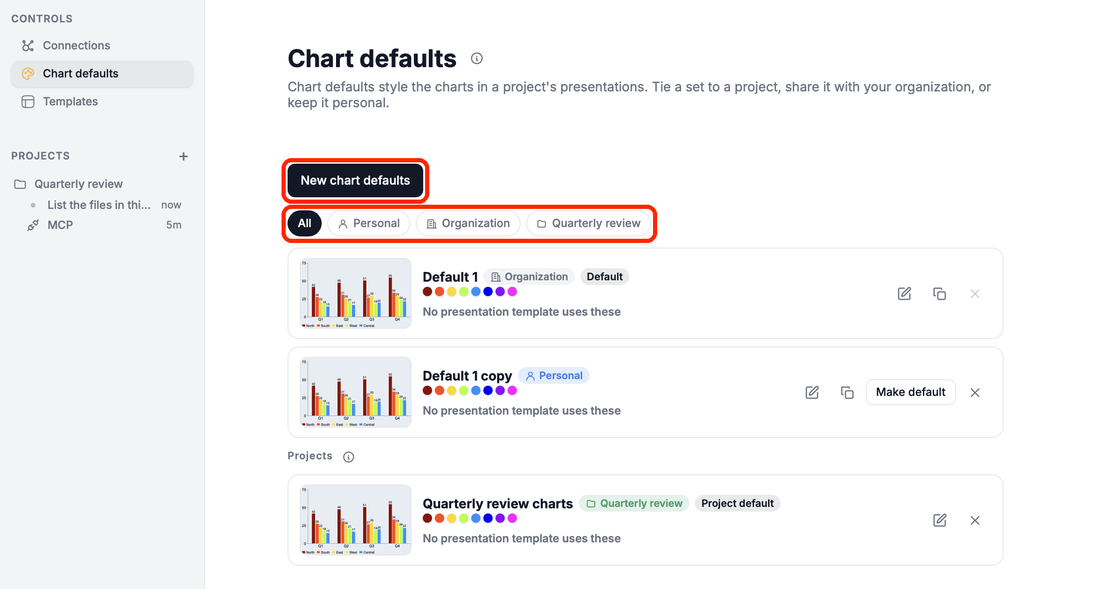
Your organization has one shared set of chart defaults, Default 1 at the start, made from your organization's brand colors and font. Style it once and every project that has no set of its own starts its charts from it.
Organization admins can change it. Members can too unless an admin changed the organization setting Who can change templates, chart defaults, fonts and colours from Everyone, its default, to Only admins or Admins and people you choose (see Ensure only admins can change chart defaults).
1. Open the organization set
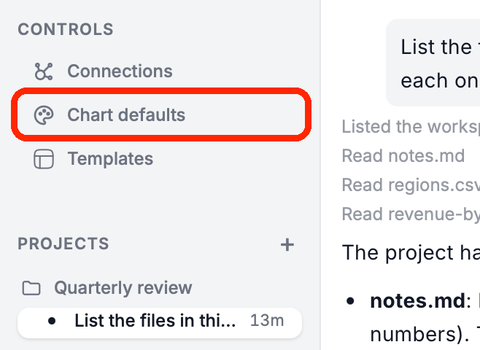
Open Chart defaults under CONTROLS in the sidebar.
Click Organization above the list, then click the organization's set to open it.
2. Style it
Go through the editor's steps, Colors to Gridlines. The preview shows the result, and your changes save as you make them. Import on Colors and Text takes the colors and font from one of your presentations.
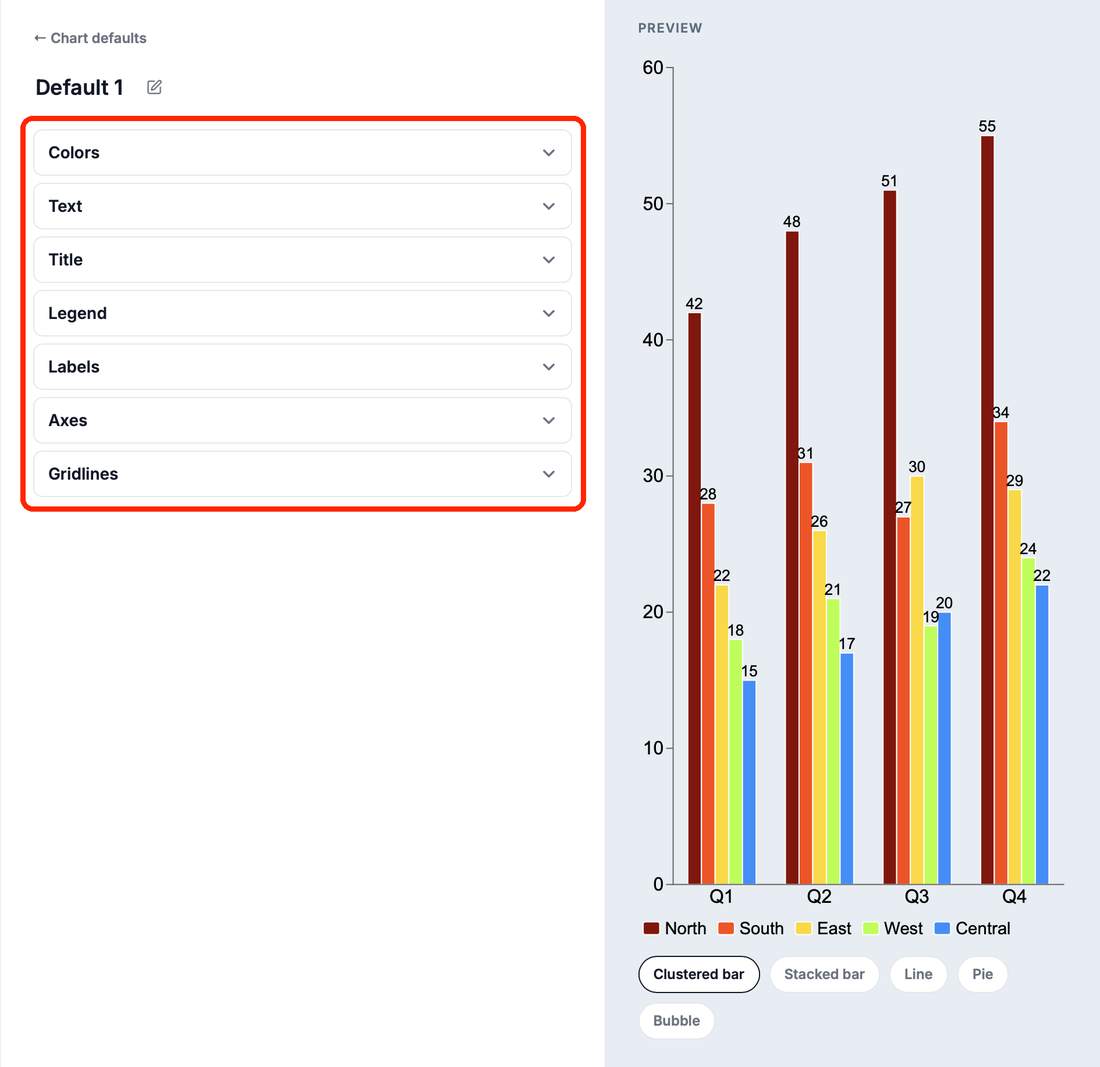
Everyone in the organization gets the change: in Hub, in the Chrome extension and in PowerPoint.
3. Add your own font
If your house font is a Google font that is not in the font list, add it on the dashboard:
- In Hub, click the gear at the bottom of the sidebar, then Account › Open dashboard.
- Open Charts and click Import a Google font.
The font then shows up for everyone in your organization.
What uses it
- Projects: new charts in a project that has no project default of its own. The project follows the organization set when it changes.
- Outside projects: each person's new charts use the set they marked Default on the Chart defaults page. To use the organization set, they click Make default on it.
- Charts made before stay as they are.
Related
- Chart defaults – levels, which set a new chart gets, and the editor
- Set a chart default set for use with a client – a different set for one project
- Ensure only admins can change chart defaults – lock the organization set