
Appearance
Chart basics
Hub edits Chartbuddy charts in their own window: waterfalls, mekkos, stacked bars and the rest of the business chart library. You can build a chart yourself, or ask the chat or your AI app to build it and then refine it by hand.
Create a chart
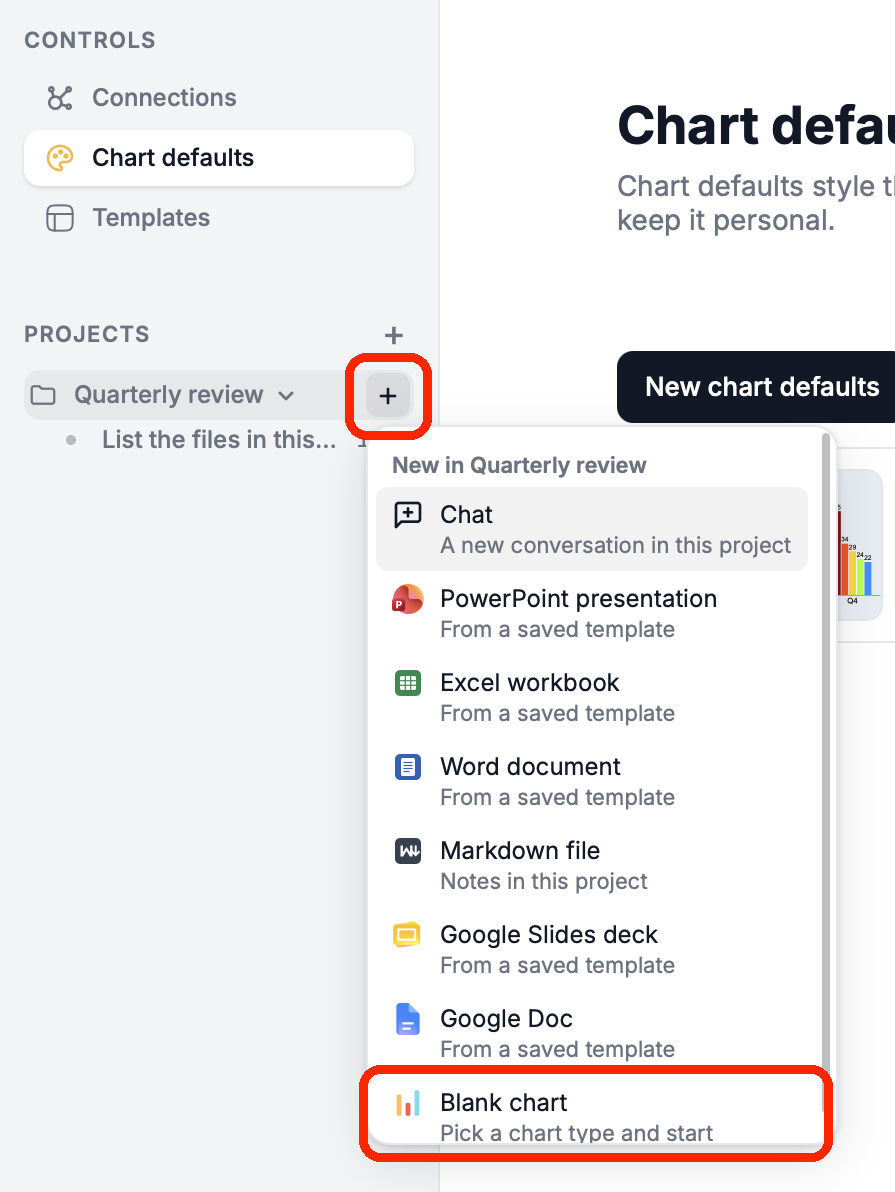
- Click + next to a project in the sidebar and choose Blank chart.
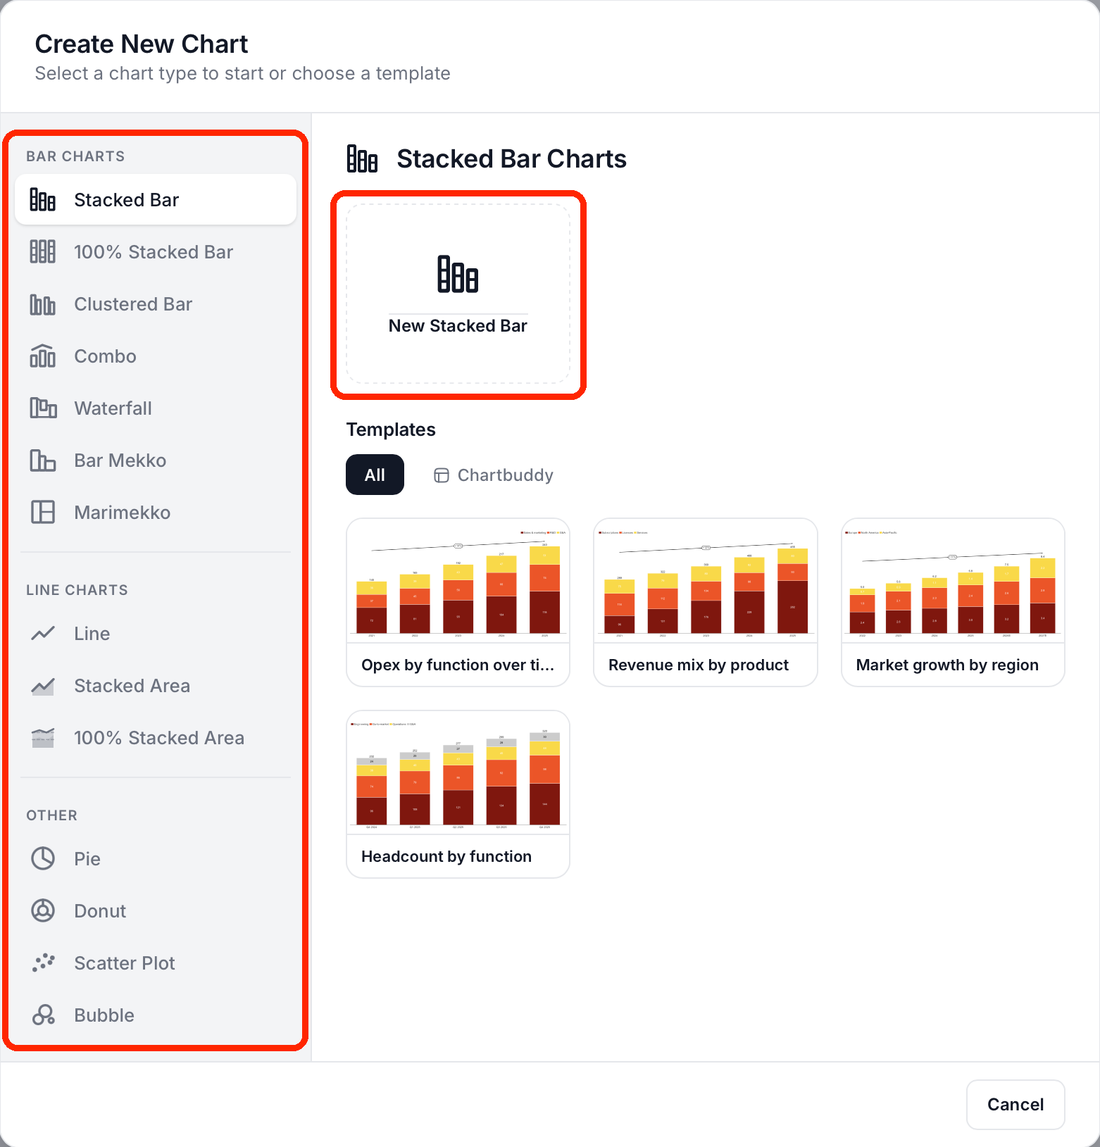
- In Create New Chart, pick a type on the left (under Bar Charts, Line Charts and Other).
- Click New {type} to start blank, or pick one of your saved templates under Templates.
A chart the chat or an AI app makes opens in the same kind of window.
The chart window
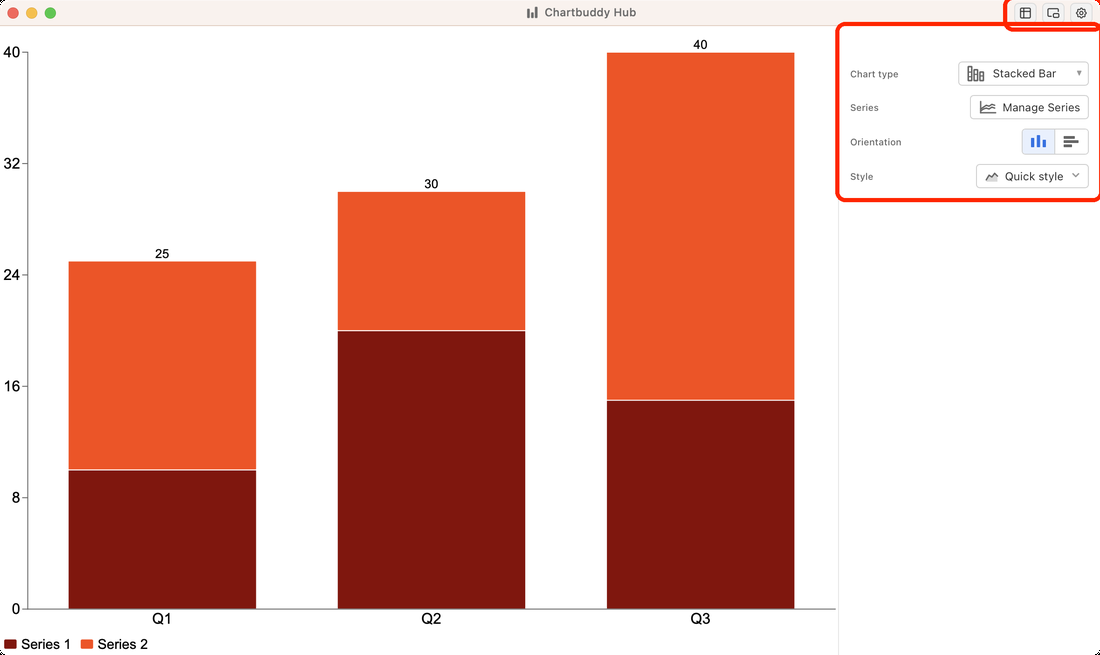
- The chart in the middle. Click any part (a bar, a label, an axis) to select it.
- The toolbar on the right. With nothing selected it shows Chart type, Series, Orientation and Style; with something selected it shows the settings for that part.
- The title bar at the top:
- Show/hide data window opens the data sheet, where you edit the numbers, categories and series.
- Drag chart to another app lets you drag the chart into a slide or document.
- Open settings.
Edit by right-clicking
Right-click the chart for most changes:
- Titles & Text: show or hide the title, subtitle and footnote; Add text box.
- Axes: show or hide axes, gridlines and labels.
- Legend: Hide legend or Show legend.
- Annotations: Add difference arrow, Add CAGR, Add level arrow, Add level line.
- Shade categories, Shade value range, Shade area: a tinted band behind the series, for a forecast period, a target band or a scatter quadrant.
Right-clicking a selected part shows the options for that part.
Save and export
Click Save. Hub saves the chart as a Chartbuddy PNG: an ordinary picture that also holds the chart's data, so you can open it and edit it again later. The menu next to Save has:
- Save as Template: keep this chart as a starting point. See Saved chart templates.
- Save As...: save a copy under another name.
- Download: export a plain PNG.
- Close without saving.
Keyboard shortcuts
| Action | Mac | Windows |
|---|---|---|
| Undo | ⌘Z | Ctrl+Z |
| Redo | ⇧⌘Z | Ctrl+Shift+Z or Ctrl+Y |
| Save | ⌘S | Ctrl+S |
| Save As | ⇧⌘S | Ctrl+Shift+S |
| Open a chart | ⌘O | Ctrl+O |
In this section
- Chart defaults – colors, fonts, labels and axes for every new chart
- Saved chart templates – start new charts from one you made